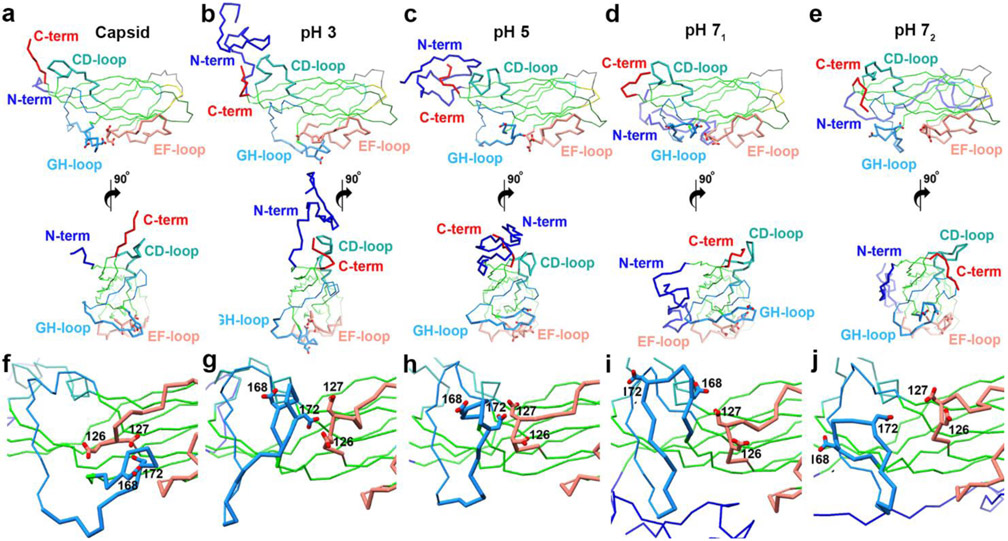
Fig. 4.
Representative conformations from the first cluster at each pH value. Regions with significant deviation from the capsid structure are highlighted according to Fig. 3b. a-e top versus bottom) Cα trace of two orientations related by an anticlockwise 90° rotation about the y-axis. a) CP extracted from assembled capsids, b) representative of most populated cluster at pH 3, c) representative of most populated cluster at pH 5, d) representative of most populated cluster from first peak at pH 7, e) representative of most populated cluster from second peak at pH 7, f-j) close-up of EF-(pink) and GH-loops (blue) showing their acidic dyads f) CP extracted from assembled capsids, g) representative of most populated cluster at pH 3, h) representative of most populated cluster at pH 5, i) representative of most populated cluster from first peak at pH 7, j) representative of most populated cluster from second peak at pH 7. RMSD values for the representative structures: b – 4,6 Å; c – 3,9 Å; d – 4.3 Å; e – 5.1 Å.

