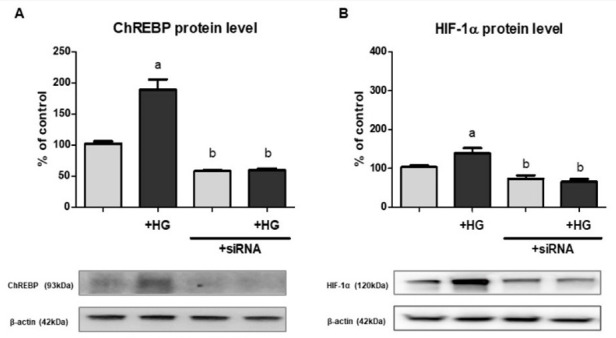
Figure 2.

The effect of ChREBP knockdown ((A)—protein, Western blot analysis) on HIF-1α expression ((B)—protein, Western blot analysis) in HK-2 cells. Cells were cultured for 24 h under normoxic conditions in the presence of normal (5.6 mM) or high (30 mM; HG) glucose concentration. Then, 24.4 mM mannitol was added to the control media to ensure the same osmolarity. Gene silencing procedure was performed as described in detail in Section 4.5. Values are means ± SEM for 3–5 experiments. Statistical significance: a p < 0.05 versus corresponding values in the presence of 5.6 mM glucose; b p < 0.05 versus corresponding values for cells untransfected with ChREBP siRNA.
