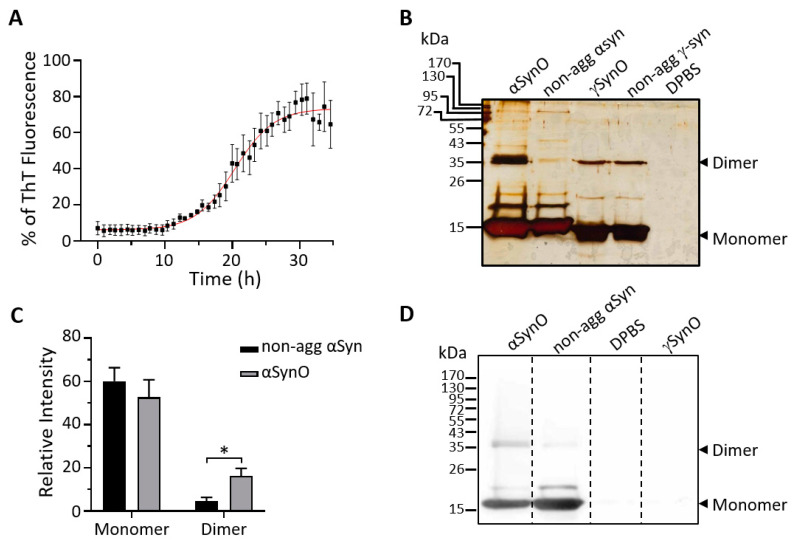
Figure 1.
Aggregation kinetics and the biochemical characterization of αSyn species. (A) Aggregation kinetics of 32 µM α-Synuclein (αSyn) in presence of 24 µM thioflavin T (ThT) in DPBS of pH 4.0, at 37 °C for 35 h. Fibril formation was monitored by an increase in ThT fluorescence at 485 nm. The graph summarizes the quantification of ThT fluorescence, adjusted to a Boltzmann sigmoidal curve. Values are expressed as a percentage of the maximum ThT fluorescence. The graph represents the mean ± SEM (n = 3 independent experiments). (B) The vehicle (DPBS, pH 4.0), non-aggregated (non-agg) αSyn and γSyn, and αSyn and γSyn after 24 h of the oligomerization process (αSynO and γSynO, respectively) were analyzed on 15% SDS polyacrylamide denaturing silver-stained gel. (C) The graph summarizes relative changes in the levels of αSyn species normalized within the same lane for the conditions described in (B). Bars represent the mean ± SEM (n = 5 independent experiments, * p < 0.05; unpaired t-test). (D) The vehicle (DPBS, pH 4.0), non-agg αSyn, αSynO, and γSynO samples were analyzed by Western blot with an anti-αSyn antibody (syn-211).

