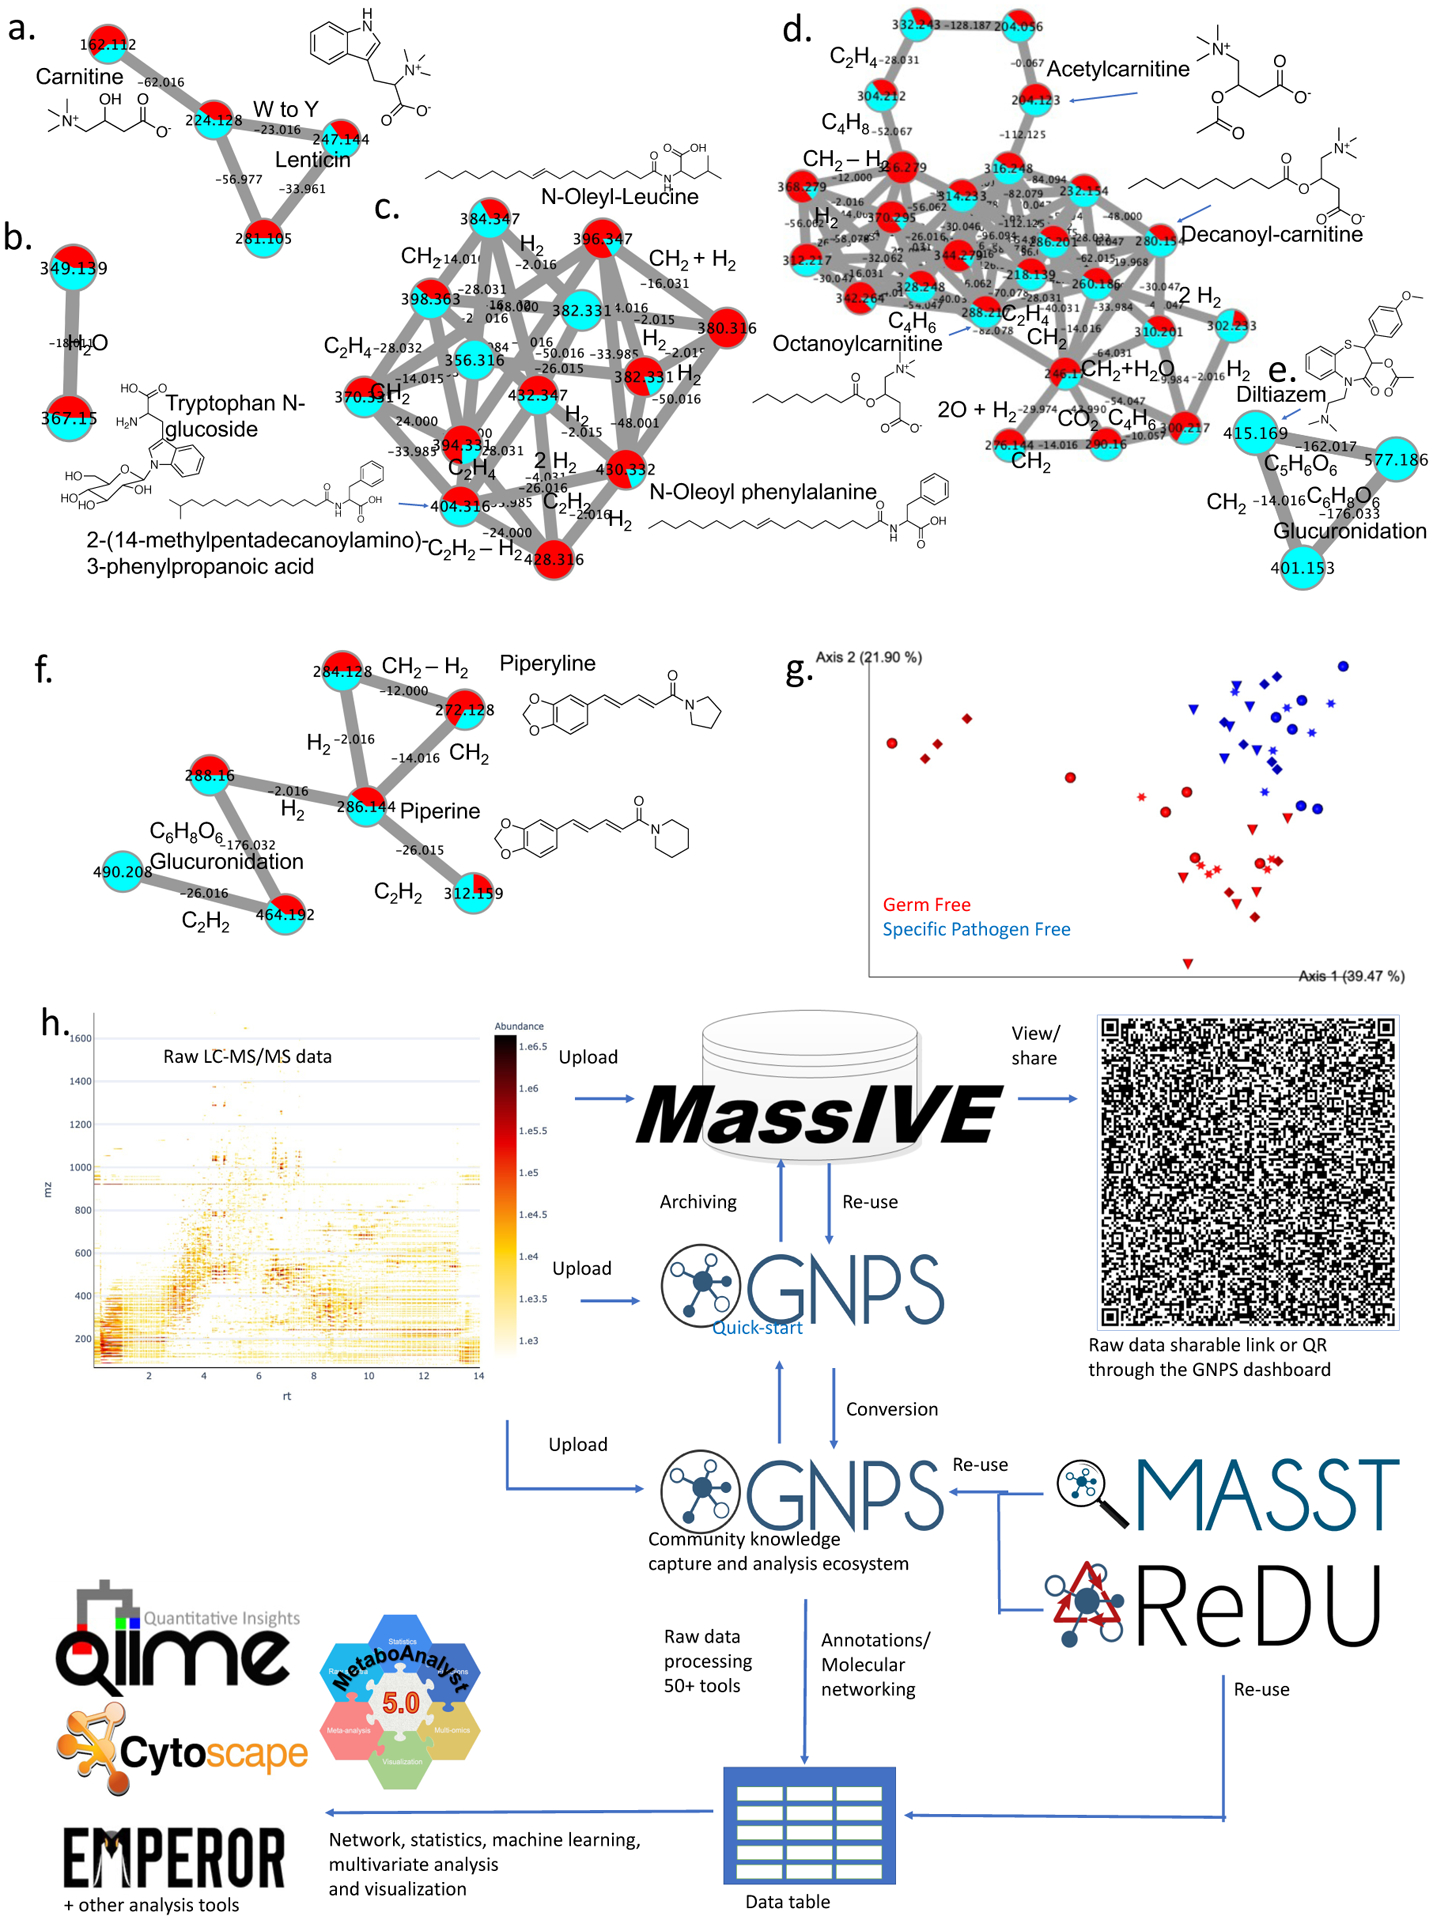
Fig. 1 |. The quick-start interface of GNPS can be used for Molecular Networking and multivariate analysis.

Representative molecular families obtained via Classical MS/MS Molecular Networking of plasma from an Alzheimer’s disease (AD) (public MassIVE data set MSV000085256, DOI 10.25345/C5D410 and complete analysis job can be accessed at https://gnps.ucsd.edu/ProteoSAFe/status.jsp?task=ab00b95c6f2149bf92973c1a6bf19be6). The molecular network is visualized with Cytoscape.4 Representative molecular families (sub-networks) reveal metabolites (a,b), lipids (c,d), drugs (e) or food-derived molecules (f) and their natural analogs (e.g. CH=CH, CH2) and metabolites from phase I (e.g. reduction, demethylation or oxidation) and/or Phase II metabolism (e.g. glucuronidation). The families are annotated based on spectral matches against MS/MS reference libraries.1 Blue are the relative levels in normal controls while red are the levels observed in the AD patients (relative levels approximated via spectral count). g, PCoA visualization of the binary Jaccard similarity of the data from multiple duodenum sections associated with germ free and specific pathogen free mice (public MassIVE data set MSV000083437, DOI 10.25345/C51G8P) using Qiime 26 and Emperor10 for visualization (An interactive link to the PCoA can be found here https://view.qiime2.org/visualization/?type=html&src=https%3A%2F%2Fcors.bridged.cc%2Fhttps%3A%2F%2Fgnps.ucsd.edu%2FProteoSAFe%2FDownloadResultFile%3Ftask%3D65a02c388b224f5dbd8311343731a8f2%26file%3Dqiime2_output%2Fqiime2_emperor.qzv%26block%3Dmain, n=4 mice for each condition, 6 sections each, each mouse is indicated by color and symbol). h, overview of the GNPS analysis ecosystem, including the new GNPS quick-start, analysis ecosystem and how it interfaces with the MassIVE repository, the GNPS search engines ReDU and MASST and the processing of data tables and external data table analysis and visualization tools. The QR code leads to the GNPS dashboard to visualize raw data.
