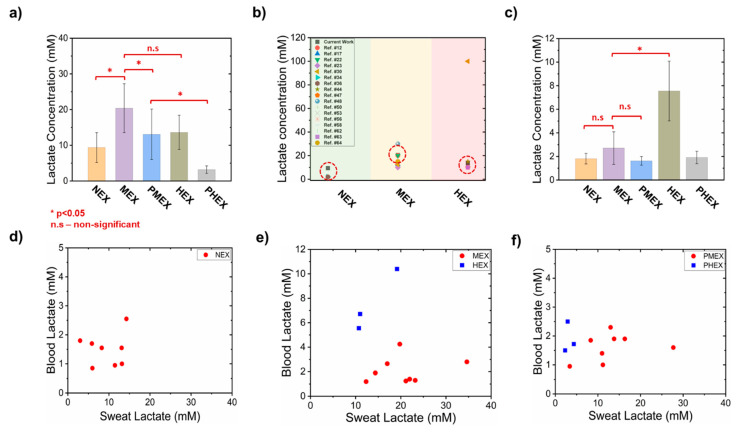
Figure 7.
Comparative analysis of sweat lactate concentration readout of 4 M glucose hydrogel patch and blood lactate concentration. (a) Plot showing the estimated sweat lactate concentration in a 4 M glucose hydrogel patch under different physiological conditions. (b) Plot presenting a comparative analysis of the lactate concentration readout from our patch (dotted circular box) to the lactate concentration data from previously published lactate studies. (c) Plot showing the measured blood lactate concentration under different physiological conditions. Relationship of sweat and blood lactate concentration during (d) NEX trial, (e) MEX and HEX trials, and (f) PMEX and PHEX trials. * denotes p < 0.05. Each dot denotes data from one subject. These plots elucidate the correlation between blood and sweat lactate levels under different physiological conditions. The error bars denote standard deviation from all subjects.

