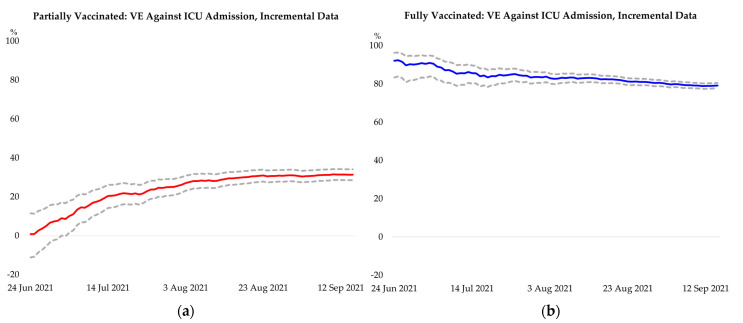
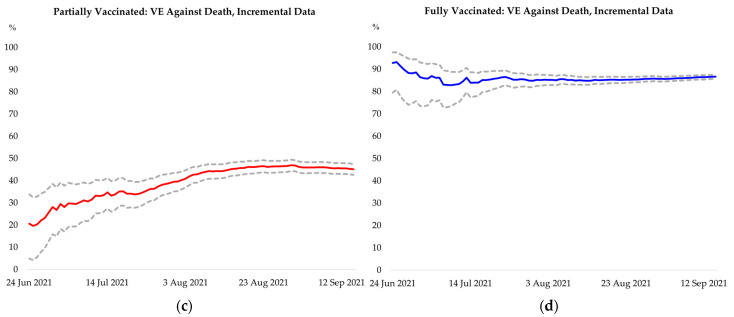
Figure 2.
Robustness check for overall effectiveness of partial and full vaccination over the study period, with line plots representing the effectiveness for COVID-19-related ICU admission and death estimated with data from 1 April 2021 up to the corresponding day on the horizontal axis; dotted lines show the 95% confidence interval. (a) Effectiveness of partial vaccination against ICU admission; (b) Effectiveness of full vaccination against ICU admission; (c) Effectiveness of partial vaccination against death; (d) Effectiveness of full vaccination against death.


