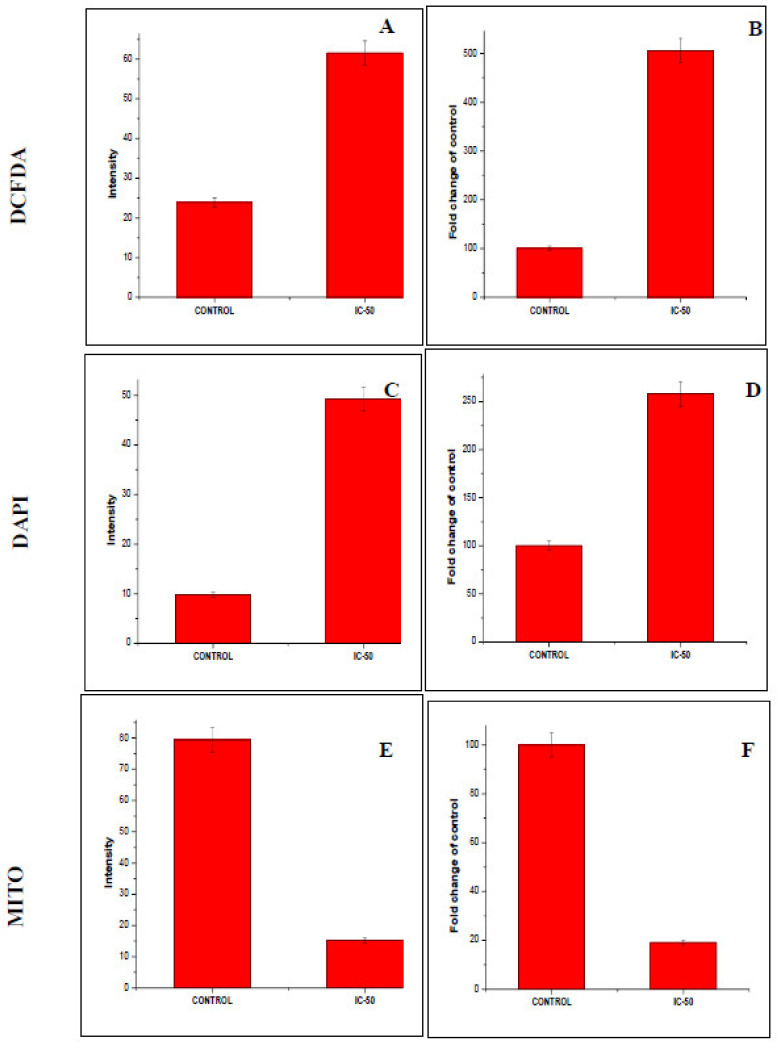
Figure 7.
Quantification of intensity and fold changes in fluorescence—via ROS, DAPI, and MITO staining—of F-AgNPs-treated A549-treated cells at IC-50 concentration, in comparison to untreated control cells. Image J software and a fluorescent microscope were used to quantify the cellular images. (A) Intracellular ROS generation intensity, (B) Intracellular ROS generation fold changes, (C) nuclear condensation intensity, (D) nuclear condensation fold changes, (E) mitochondrial content intensity, and (F) mitochondrial content fold changes, graphs. Every datum shown is the mean ± SD of three experiments.

