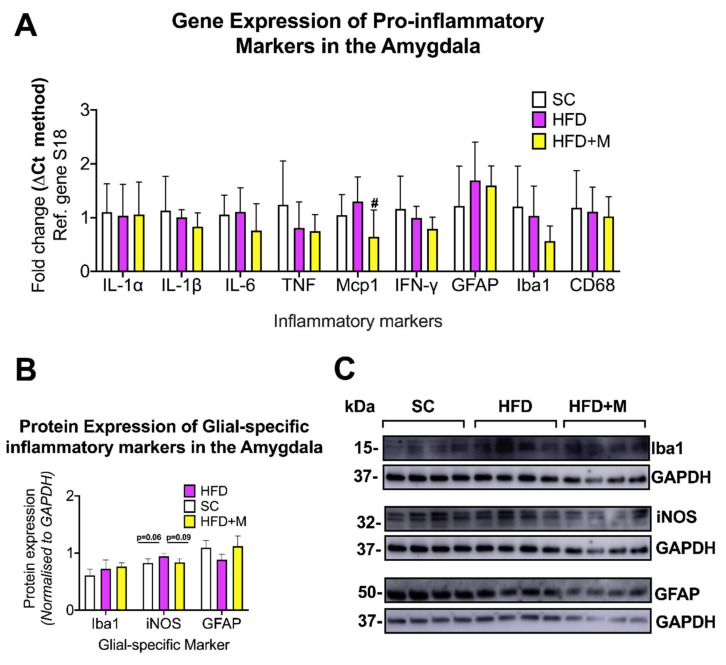
Figure 5.
Gene and protein expression analysis of cytokines and glial-specific inflammatory markers in the amygdala of C57BL/6 mice in response to HFD or metformin administration. Mice were grouped as SC, HFD, and HFD + M. Amygdala were microdissected from the left and right sides of the brain from all treatment groups and were used for RNA and protein extraction with subsequent quantitative qPCR and Western blotting, respectively. (A) Differential gene expression levels of proinflammatory mediators and glial-specific inflammatory markers. (B) Protein expression levels of glial-specific inflammatory marker following normalization to the loading control, GAPDH. (C) Immunoblot bands for each marker. mRNA levels were quantified using the ΔCt method and normalized to the reference gene S18 (housekeeping gene). Data were presented as mean ± S.E.M. # p < 0.05 vs. HFD group as determined by one-way ANOVA followed by Tukey post-hoc test. n = 6–8 per group. Quantification of immunoblot bands was performed using the NIH ImageJ software. Data were given as mean ± S.E.M. P values were determined by one-way ANOVA followed by Tukey post-hoc test. n = 4 per group.

