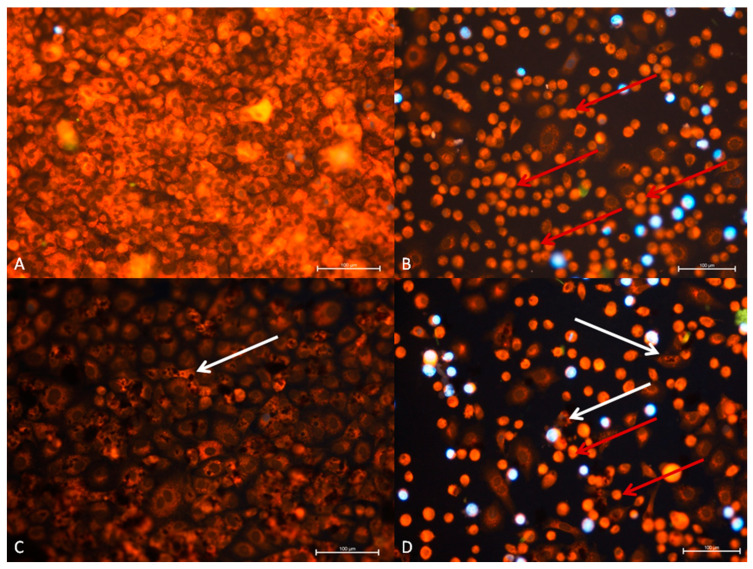
Figure 7.
A549 (ATCC-CCL-185TM) cell line 24 h after administration of virus and GO. (A) Control group, (B) RuV group, (C) GO group, (D) RuV + GO group. Normal cells show regular, oval shape with nucleus present in the middle of the cells. Peripheral cytoplasm is well visible. In response to the RuV cytopathic effect is noted in most of the A549 cells line. Cells have reduced volume, with cytoplasm condensed around nucleus. In GO group dark aggregates are present inside and covering cells (white arrow). DAPI and Rhodamine B. Mag 100x. Scale bar 100 µm.

