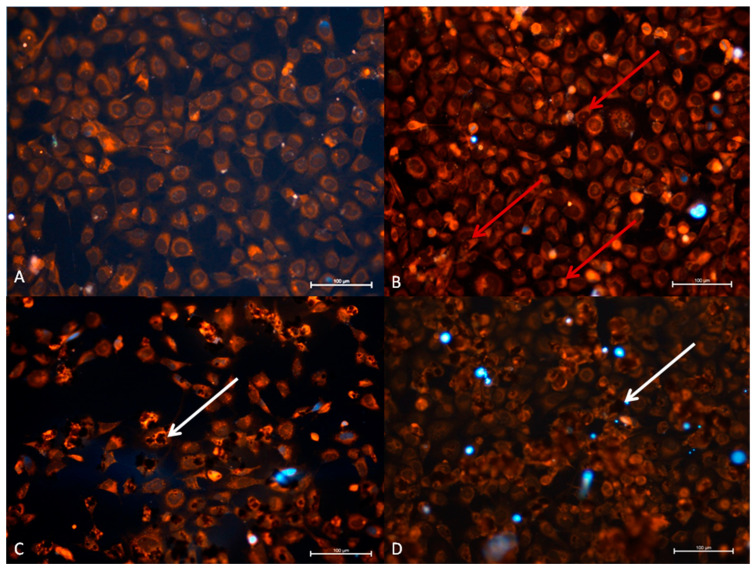
Figure 8.
TC28a2 cell line 24 h after administration of virus and GO. (A) Control group, (B) RuV group, (C) GO group, (D) GO + RuV group. Mild cytopathic effect in cells with changed morphology (red arrow) after RuV administration is visible (red arrow).Visible graphene covering cells (white arrow) in both GO and GO + RuV treated cells. DAPI and Rhodamine B. Mag 100x. Scale bar 100 µm.

