Figure 2.
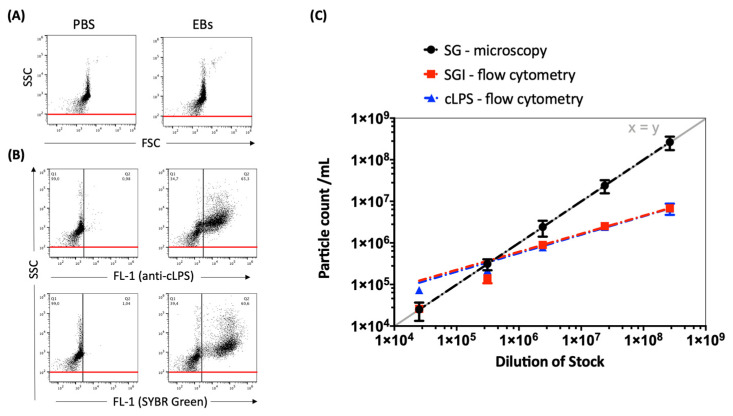
(A) Representative dot plots of C. trachomatis (serovar E) EB/RB preparations, side scatter (SSC) vs. forward scatter (FSC), compared to phosphate-buffered saline (PBS). (B) Representative dot plots of C. trachomatis preparations (concentration of 2.39 × 10⁶/mL) stained with either FITC-conjugated cLPS mAb B410F or nucleic acid stain SGI; SSC (488-10+OD2 filter) vs. fluorescence intensity (FL-1, emission filter 530/30 nm, log scale) is shown. PBS supplemented with both dyes without EBs/RBs was measured to determine the background noise; fluorescence cut-off values were set at 1% (black line) and the SSC threshold at 100 (red line). (C) Counts of SGI- vs. cLPS-stained EB/RB-dilutions (from 1:100 to 1:1,000,000) measured by flow cytometry compared to the DPCs of SYBRTM Gold (SG)-stained EBs/RBs analyzed by epifluorescence microscopy. The exponential trend lines were fitted and shown with a graph of standard linear relation (y = x, grey line).

