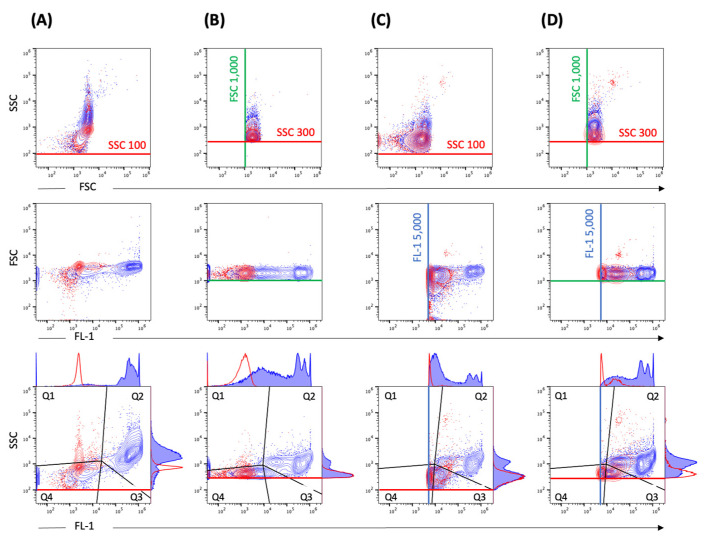
Figure 3.
Standard instrument filter settings. Representative contour plots of EBs/RBs (serovar E) at a concentration of 2.39 × 10⁷/mL stained with SGI (blue) in comparison to SGI-incubated PBS reagent control (red). The measurement was performed with different threshold settings: (A) SCC 100, (B) SSC 300 and FSC 1000, (C) SCC 100 and FL-1 5000, (D) SSC 300 and FSC 1000 and FL-1 5000. The thresholds are marked with corresponding lines (SSC 100 or SSC 300—red, FSC 1000—green, FL-1 5000—blue). The gating strategy (black lines) including the corresponding histograms with a definition of the positive population in gate quadrant 2 (Q2) is shown in the last row.

