Figure 5.
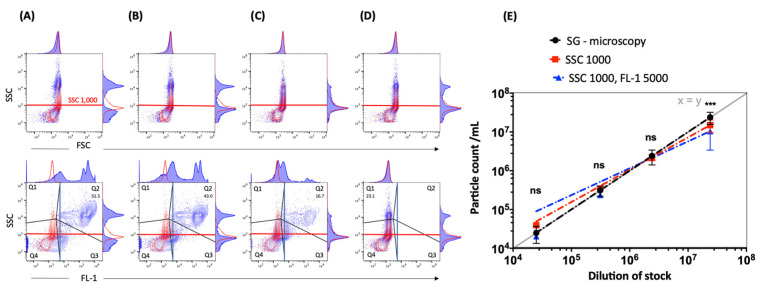
Superior discrimination of EBs/RBs with implementation of a small particle SSC filter. Representative contour plots with corresponding histograms of SSC (SSC 488-10 filter) vs. FSC or FL-1 fluorescence intensity (log scale, FL-1: 530/30-nm filter) of EBs/RBs (serovar E) at the following concentrations: (A) 2.39 × 10⁷/mL, (B) 2.41 × 10⁶/mL and (C) 2.98 × 10⁵/mL stained with SGI. The positive population is shown in gate Q2. PBS stained with SGI (red) is used as a reagent control. (D) Unstained EBs/RBs (blue) at 2.41 × 10⁶/mL are shown in gate Q1 and compared to PBS (red). For presentation purposes the threshold was set on SSC 100 and completed with threshold marks used in further measurements: SSC 1000 (red lines), FL-1 5000 (blue lines). The numbers represent percentages of EB/RB preparations (blue contour plots) in the positive gate. (E) Measurements of particle counts with new threshold settings. Serial dilutions (from 2.39 × 10⁷/mL to 2.5 × 10⁴/mL) of EBs/RBs (serovar E) counted by fluorescence microscopy (DPC microscopy, black trend line) compared to measurements by flow cytometry (gate Q2) without (SSC 1000) or with (SSC 1000 + FL-1 5000) a fluorescence trigger. The exponential trend lines were fitted with corresponding equations and R-squared values. The statistical analysis was done using one-way ANOVA and Dunn’s multiple comparisons test. p values < 0.05 were considered statistically significant; *** p < 0.001.

