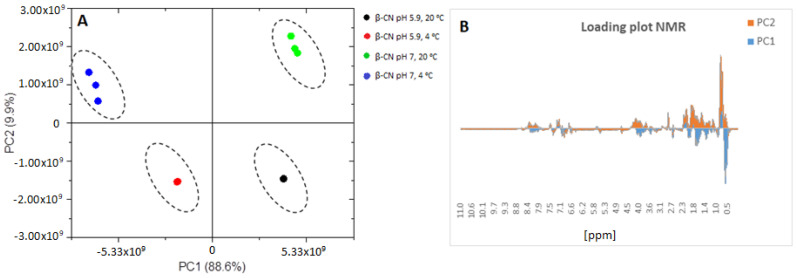
Figure 3.
Principal components score plot (A) and loading plot (B) of β-casein of the NMR spectra in where β-casein at pH 5.9 and temperature of 20 °C (black), β-casein at pH 5.9 and temperature of 4 °C (red), β-casein at pH 7.0 and temperature of 20 °C (green) and β-casein at pH 7.0 and temperature of 4 °C (blue) are in (A) and PC1 (blue) and PC2 (orange) are in (B).

