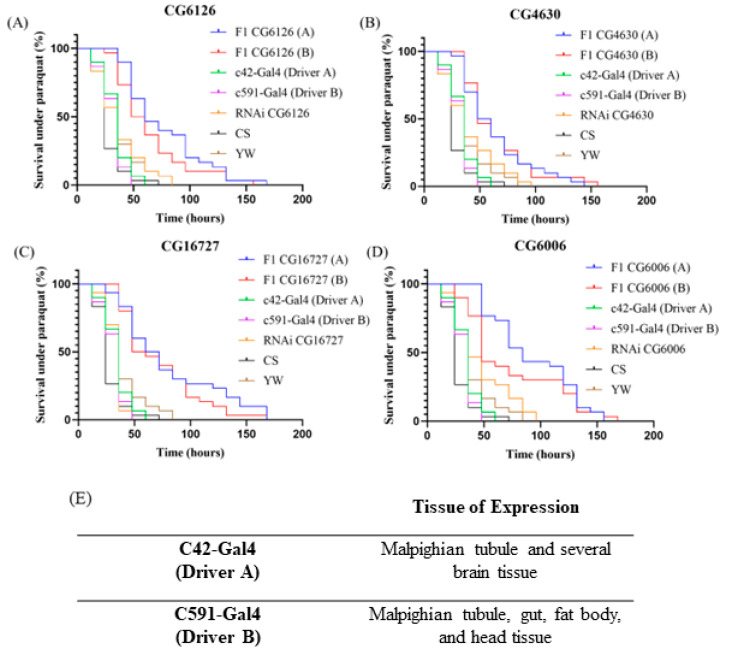
Figure 3.
Kaplan-Meier survival curves of tissue specific RNAi knockdowns were created. CG6126 (A); CG4630 (B); CG16727 (C); CG6006 (D). All lines were observed for 168 h. Survival was recorded every 12 h. F1 A and B denote RNAi knockdowns created with Drivers A and B, respectively (E). RNAi and Gal4 represent parent lines. YW and CS denote wild-type Drosophila strains.

