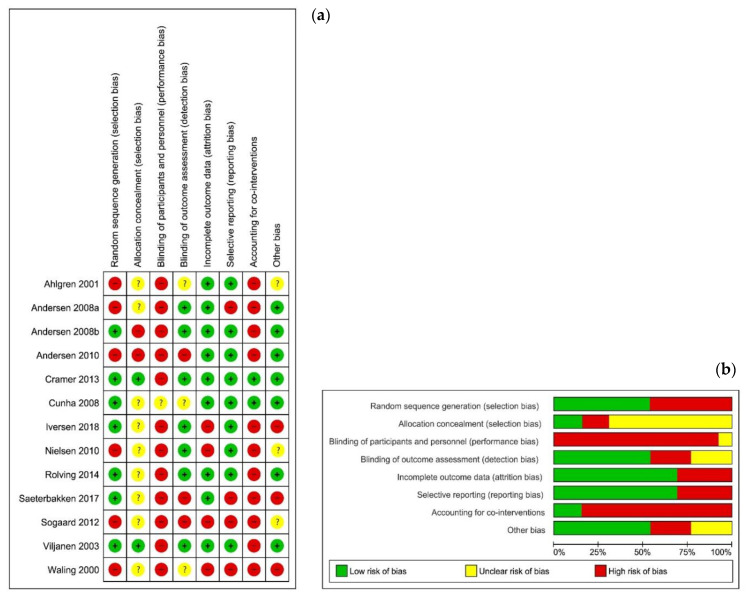
Figure 2.
Risk of bias summary. These graphs illustrate the review authors’ judgements about each risk of bias item for each included study (a) and presented as percentages across all included studies (b). Review Manager (RevMan) 5.3. [34]. Legend: (+) indicates “low risk of bias”; (?) indicates “unclear risk of bias”; (−) indicates “high risk of bias”.

