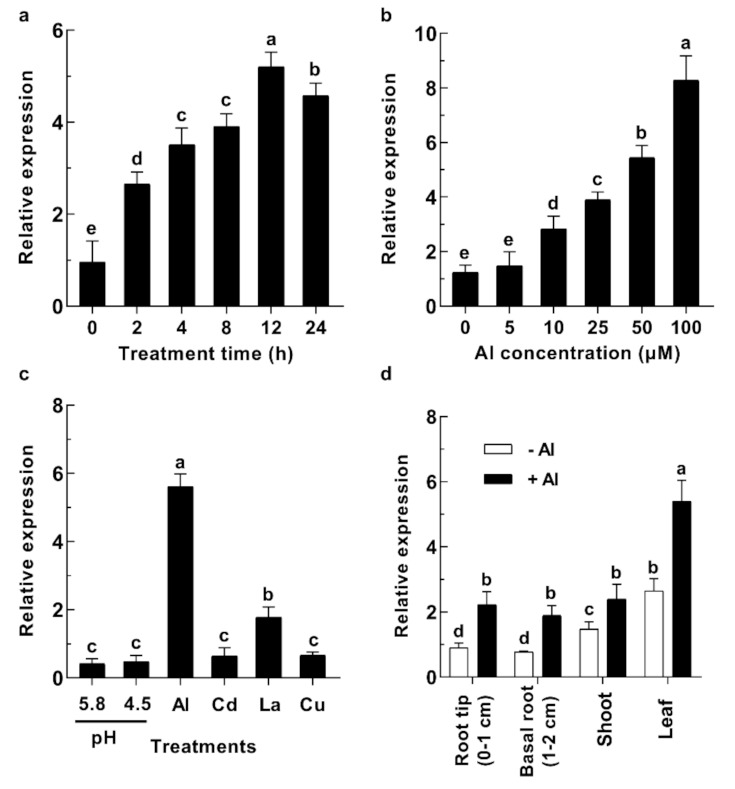
Figure 3.

The detection of the GsABCI1 expression pattern. (a) Time-dependent expression pattern of GsABCI1. Plants were treated with a solution containing 50 μM AlCl3 for 0, 2, 4, 8, 12, and 24 h. Root tips (0–1 cm) were collected for qPCR after different time treatments. (b) Dose-dependent expression pattern of GsABCI1. Plants were exposed to a solution containing 0, 5, 10, 25, 50, or 100 μM AlCl3 for 8 h. Root tips (0–1 cm) were collected for qPCR after 8 h in different Al treatments. (c) The GsABCI1 expression of response to metals and different pH values. Seedling plants were grown under different pH (pH 4.5, or 5.8) conditions or in solutions (pH 4.5) containing 50 μM AlCl3, 23 μM CdCl3, 10 μM LaCl3, or 0.5 μM CuCl2 for 8 h. Root tips (0–1 cm) were collected for qPCR after 8 h in different treatments. (d) Tissue-specific expression pattern of GsABCI1. Seedling plants were cultivated in a solution with 0 or 50 μM AlCl3 for 12 h. Root tips (0–1 cm), Basal roots (1–2 cm), shoots, and leaves were collected for qPCR after treatment. The expression levels of all candidate genes were determined by using the 2−ΔΔct method. The data are the means ± SDs (n = 3). The different letters indicate significant differences at p < 0.05 as determined by Student’s t-test.
