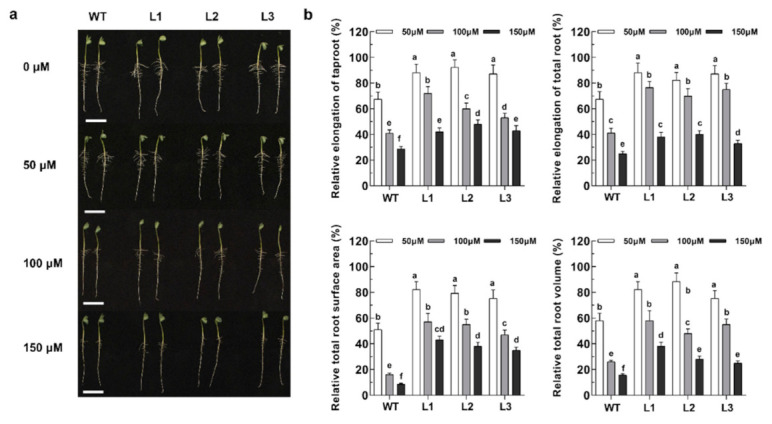
Figure 4.

Phenotypic detections of the GsABCI1 transgenic soybean lines. (a) Morphological analysis of the roots of the WT and three transgenic lines (L1, L2, L3). (b) Analysis of relative taproot elongation, relative total root elongation, relative total root surface area, and relative total root volume in the WT and three transgenic lines (L1, L2, L3). Soybean seedlings with consistent growth were identified and transferred into a 0.5 μM CaCl2 hydroponic solution (pH 4.5) containing 0, 50, 100, or 150 μM AlCl3 for 12 h. Photograph taken, scanned, and acquired data through Image J. Bar = 5 cm. The data are the means ± SDs (n = 16). The different letters indicate significant differences at p < 0.05 as determined by Student’s t-test.
