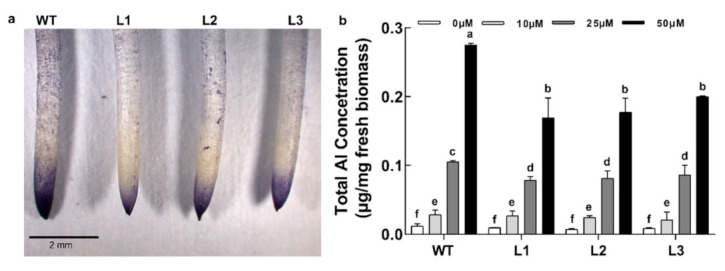
Figure 5.

Analysis of Al accumulation patterns. (a) Al-treated (25 μM AlCl3 for 24 h) roots of WT and transgenic soybean lines were stained with hematoxylin, washed, and photographed. Bar = 2 mm. (b) The total Al accumulation in the roots. Soybean seedlings with consistent growth were transferred into a 0.5 μM CaCl2 hydroponic solution (pH 4.5) containing 0, 10, 25, or 50 μM AlCl3 for 24 h. The Al of the roots (0–6 cm) was extracted by 2N HCl and determined. The data are the means ± SDs (n = 12). The different letters indicate significant differences at p < 0.05 as determined by Student’s t-test.
