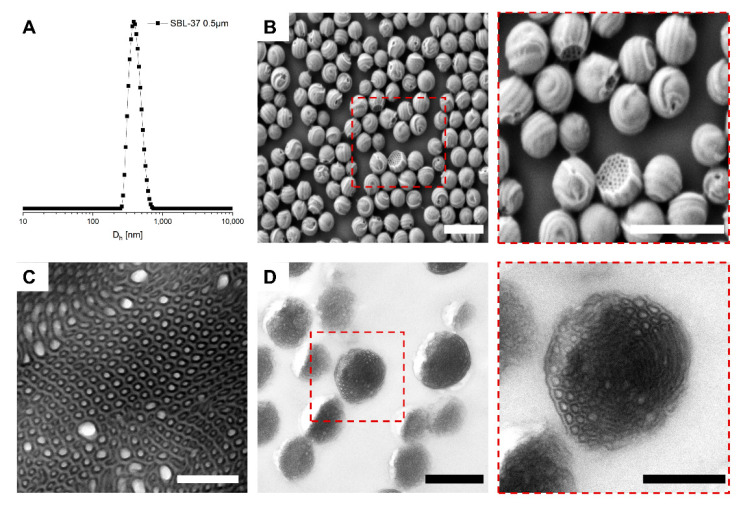
Figure 2.
SBL-37 MMs prepared with the membrane dpore = 0.5 µm. (A) Size distribution from DLS CONTIN plot. (B) SEM overview image and close-up (scale bars 1000 nm). (C) TEM image of the SBL-37 bulk morphology (scale bar 500 nm) and (D) TEM of cross-sections of embedded SBL-37 MMs (dpore = 2.0 µm) visualizing the inner morphology (TEM samples stained with OsO4 to enhance the contrast of PB; PLLA appears brightest, scale bars 1000 nm and 500 nm in inset).

