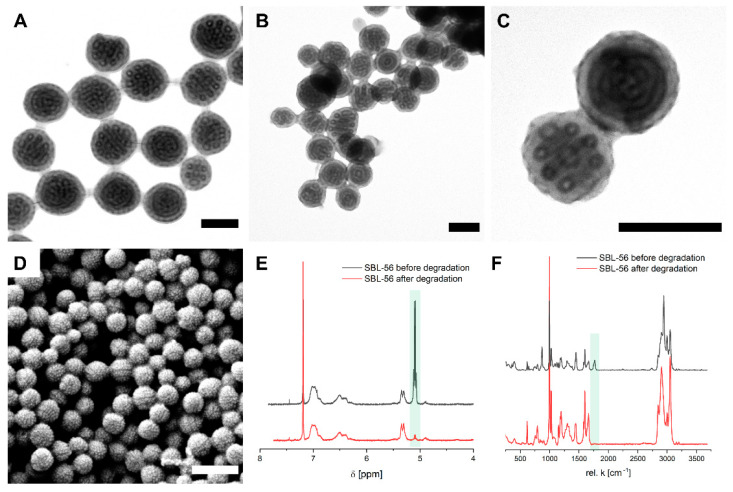
Figure 5.
Degradation of SBL-56 MMs under basic conditions for 5 days (membrane with dpore = 0.3 µm). (A) TEM overview image before and after degradation (B) (scale bars 200 nm). (C) TEM close-up and (D) SEM image after degradation (scale bars 500 nm). (E) 1H-NMR and (F) Raman measurements before (black) and after degradation (red).

