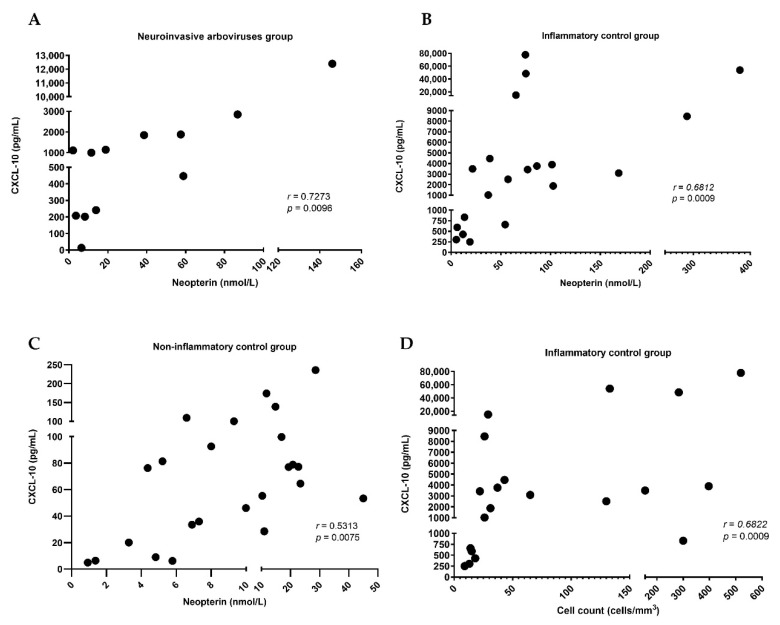
Figure 2.
Correlation between CXCL-10 and neopterin in each group and between CXCL-10 and cell count in inflammatory control group: (A) neuroinvasive arboviruses group; (B) inflammatory group; (C) non-inflammatory control group; (D) correlation between CXCL-10 and cell count in the inflammatory group. Each dot represents 1 sample. Correlation coefficient (r) was calculated using the Spearman test; r and p values are shown. For the correlation between CXCL-10 and neopterin, the Spearman test demonstrated a very strong correlation (r = 0.7273; p = 0.0096) in neuroinvasive arboviruses group, and a strong correlation in inflammatory control group (r = 0.6812; p = 0.0009) and non-inflammatory control group (r = 0.5313; p = 0.0075). The correlation between CXCL-10 and cell count in neuroinvasive arboviruses group was strong (r = 0.6822; p = 0.0009). Reference values of Spearman test: r ≥ 0.70 is very strong correlation, r = 0.40 to 0.69 is a strong correlation, r = 0.30 to 0.39 is a moderate correlation, r = 0.20 to 0.29 is a weak correlation, and r = 0.01 to 0.19 is a negligible correlation or non-correlation. p < 0.05 values are significant.

