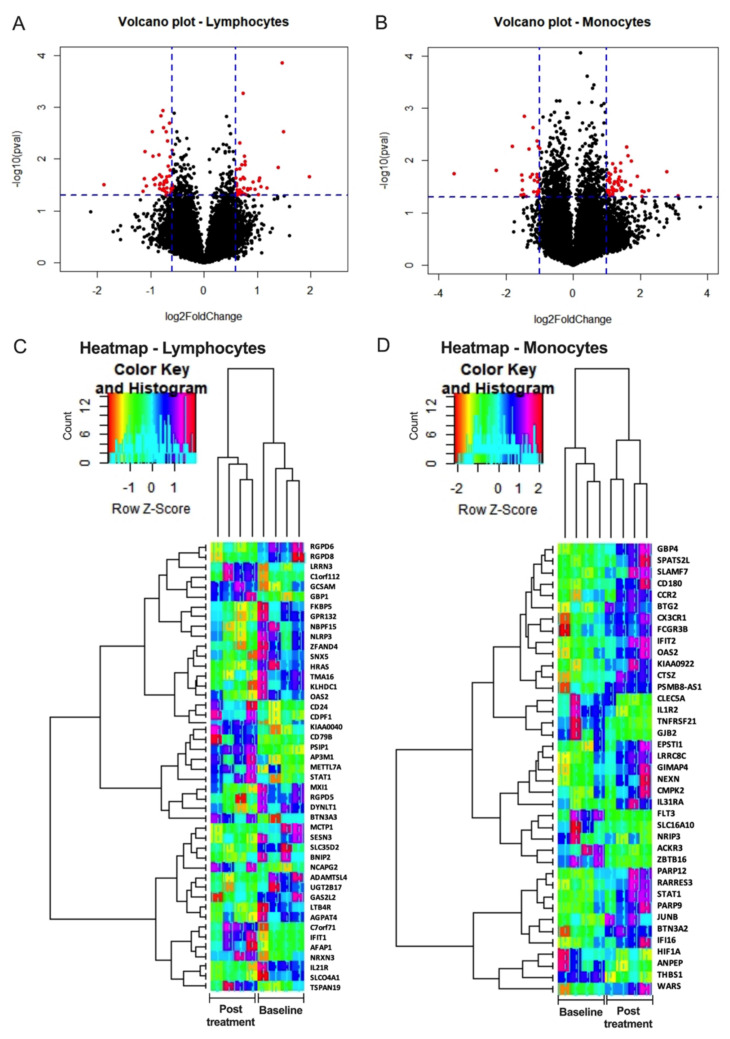
Figure 6.
Differential gene expression analyses in lymphocytes and monocytes after oral-SLGN treatment in healthy subjects. Sorted monocytes and lymphocytes from BL and 8 h post-SLGN (3.0 mg) treatment were used for microarray analysis (n = 4). Volcano Plots show the transcriptomics analyses of differentially expressed mRNAs from (A) lymphocytes and (B) monocytes post-SLGN treatment versus pre-treatment (baseline) samples. Heatmap analysis of top 50% deregulated genes and dendrogram generated by cluster analysis in (C) lymphocytes and (D) monocytes are presented.

