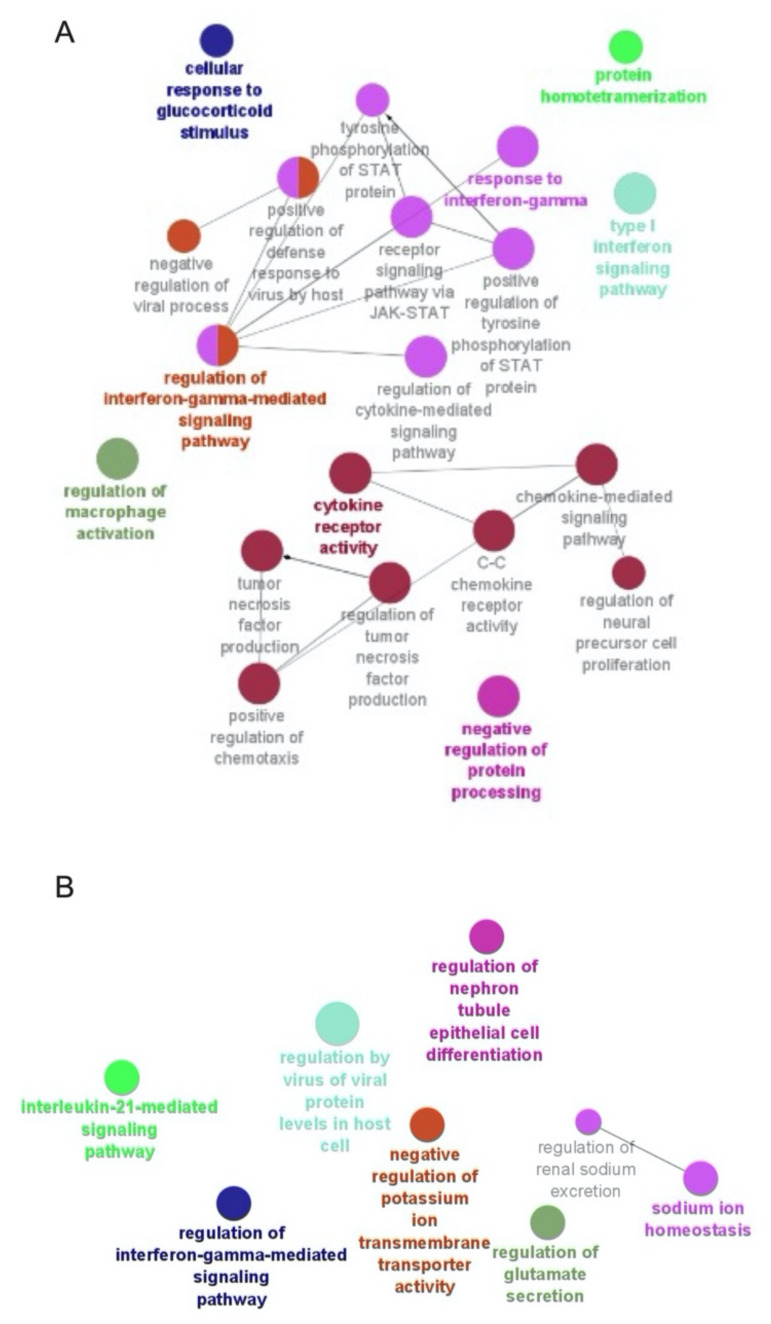
Figure 7.
GO term enrichment analysis. The enriched functionally grouped networks of Biological Process category GO terms associated with deregulated genes from monocytes (A) and lymphocytes (B). The network of functionally grouped GO terms is built in Cytoscape v3.9.0 using the plugin ClueGO v2.5.8. The nodes are representative functional group GO terms and the edges are the associations based on a kappa score, as calculated in ClueGO. Different colors signify different GO terms’ functional groups. Only nodes with a p-value ≤ 0.05 are represented in the figures.

