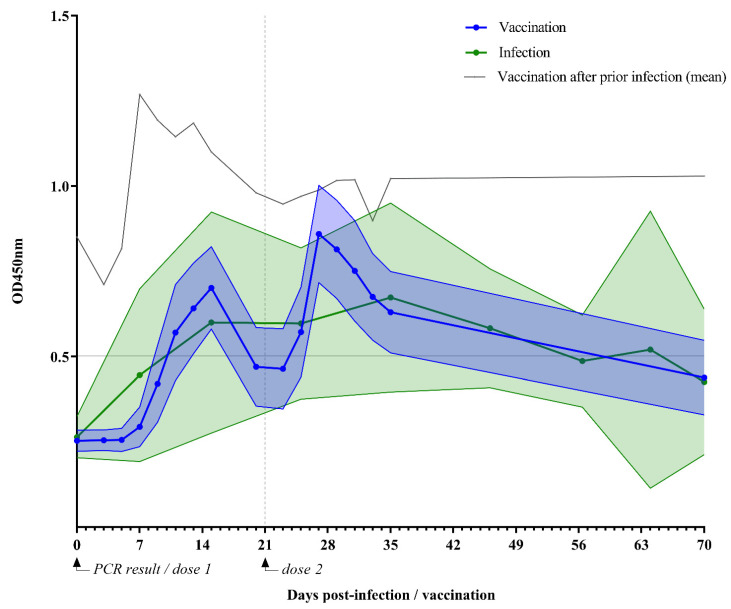
Figure 2.
SARS-CoV-2-specific IgA levels following vaccination or infection. OD450 nm indicates optical density 450 nm. This figure shows specific IgA levels in human milk of lactating women over 70 days after vaccination with the mRNA-based COVID-19 vaccine BNT162b2 (n = 26) or a naturally acquired SARS-CoV-2 infection (n = 18). The solid dotted lines indicate mean IgA level in human milk following vaccination (blue) or infection (green); filled area between error lines indicates 95% confidence interval. The grey solid line indicates the mean IgA level in human milk following vaccination after prior infection (n = 2). The horizontal grey line at 0.502 represents the cutoff value for the detection limit of IgA in human milk.

