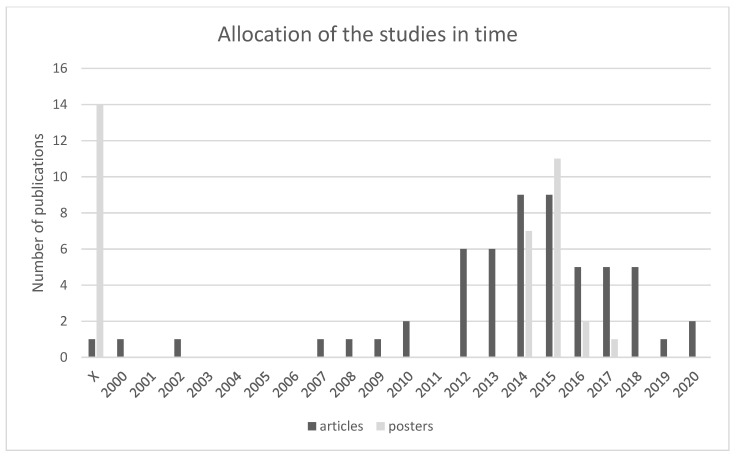
Figure 5.
Shows the allocation of publications in time which suggests a significant increase of such publications since 2012. In total, 60 articles and 39 posters were included in the research. Most articles were published between 2014 and 2015 and most posters were published in 2015 [1,2,3,4,5,6,7,8,9,10,11,12,13,14,15,16,17,18,19,20,21,22,23,24,25,26,27,28,29,30,31,32,33,34,35,36,37,38,39,40,41,42,43,44,45,46,47,48,49,50,51,52,53,54,55,56,57,58,59,60,61,62,63,64,65,66,67,68,69,70,71,72,73,74,75,76,77,78,79,80,81,82,83,84,85,86,87,88,89,90,91,92,93,94,95,96,97,98,99].

