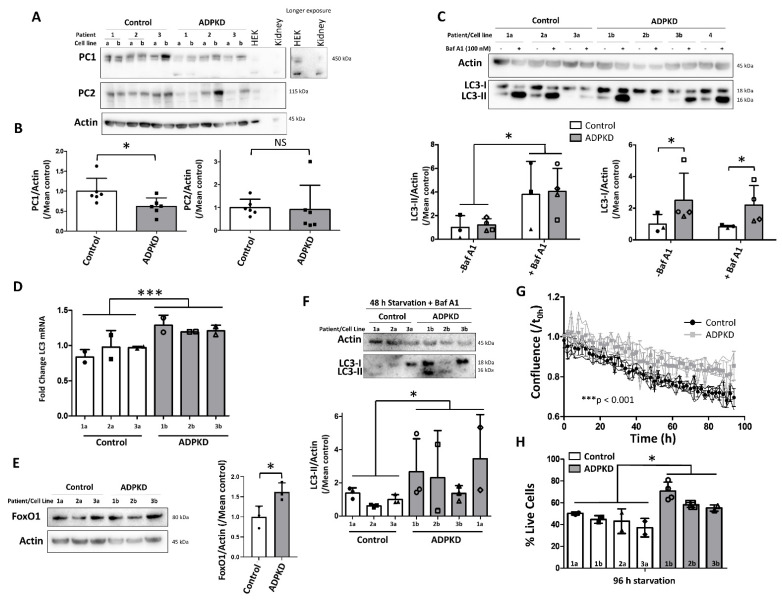
Figure 7.
Enhanced starvation-induced autophagy in proximal tubular cell lines derived from ADPKD patients. (A) Western blot analysis of the annotated proteins in proximal tubular epithelial cells (PTECs) from 3 young healthy individuals (Control 1–3) and ADPKD patients (ADPKD 1–3). For each individual, 2 monoclonal cell lines were analyzed (a,b). Human embryonic kidney (HEK) cell lysate and lysate of human renal tissue (kidney) were used as controls. (B) Quantification of polycystin-1 (PC1) and -2 (PC2) over Actin, normalized to the mean of the control group, in the 6 Control (white) and 6 ADPKD (grey) PTECs. (C) LC3 Western blot analysis in 3 PTECs from 3 young individuals (1a, 2a and 3a; white) and 4 cell lines from 4 young ADPKD patients (1b, 2b, 3b and 4; grey). Cells were treated with DMSO (−Baf A1) or 100 nM Baf A1 (+Baf A1) for 3 h before harvest. Upper: representative Western blot. Lower left: quantification of the average LC3-II levels over Actin, normalized to the mean of the control group. Lower right: quantification of the average LC3-I levels over Actin, normalized to the mean of the control group. (D) LC3 mRNA expression was evaluated by quantitative PCR (qPCR) in 3 PTECs from 3 young healthy individuals (Control 1a, 2a, 3a; white + closed symbols) and 3 young ADPKD patients (1b, 2b, 3b; grey + open symbols). The symbols represent the 2 independent experiments in each cell line. (E) FoxO1 protein levels in 3 PTECs from 3 young healthy individuals (Control 1a, 2a and 3a) and 3 PTECs from 3 young ADPKD patients (1b, 2b and 3b). Left: representative Western blot; right: quantification of FoxO1 levels over Actin (N = 2). (F) LC3 Western blot analysis in 3 PTECs from 3 young healthy individuals (1a, 2a and 3a; white + closed symbols) and 4 PTECs from 3 young ADPKD patients (1a, 1b, 2b and 3b; grey + open symbols), subjected to 48 h of starvation. Cells were treated with 100 nM Baf A1 (+Baf A1) for 3 h before harvest. Upper: representative Western blot. Lower: quantification of the average LC3-II levels over Actin of 3 independent experiments in 7 cell lines. Each symbol represents an independent experiment. (G) Analysis of confluence of 4 control (black) and 4 ADPKD (grey) PTECs during incubation in HBSS using the IncuCyte Live Cell Analyzer. The curve of each cell line is plotted with the average of each group represented by the superimposed symbols. Linear regression analysis revealed significantly different slopes between Control and ADPKD group. (H) Percentage live cells following 96 h of incubation in HBSS as analyzed by Trypan blue exclusion in 4 PTECs from 3 young healthy individuals (1a, 1b, 2a and 3a; white + closed symbols) and 3 PTECs from 3 young ADPKD patients (1b, 2b and 3b; grey + open symbols). Each symbol represents an independent experiment. Throughout this figure, the same individuals/patients are assigned with the numbers 1 to 4, while monoclonal cell lines with letters a and b. NS: not significant, ∗ p < 0.05, ∗∗∗ p < 0.001.

