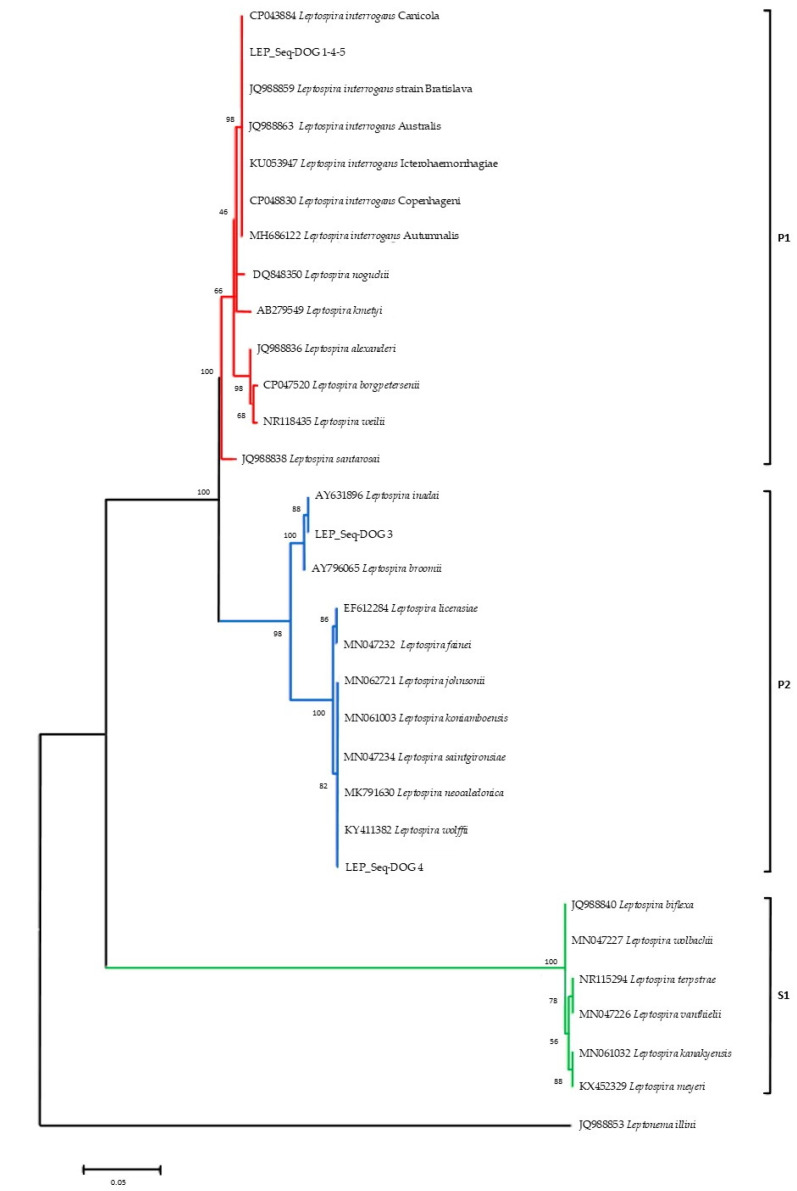
Figure 3.
16S rRNA phylogeny of the identified Leptospira serovars and sequence representative of Leptospira species diversity. Pathogenic (P1), intermediate (P2), and saprophytic (S1) clades are indicated in red, blue, and green, respectively. Evolutionary analyses were conducted with MEGA 6 by using the Maximum Likelihood method based on the Kimura 2-parameter model. The bootstrap consensus tree inferred from 1000 replicates. The tree is drawn to scale, with branch lengths in the same units as those of the evolutionary distances used to infer the phylogenetic tree.

