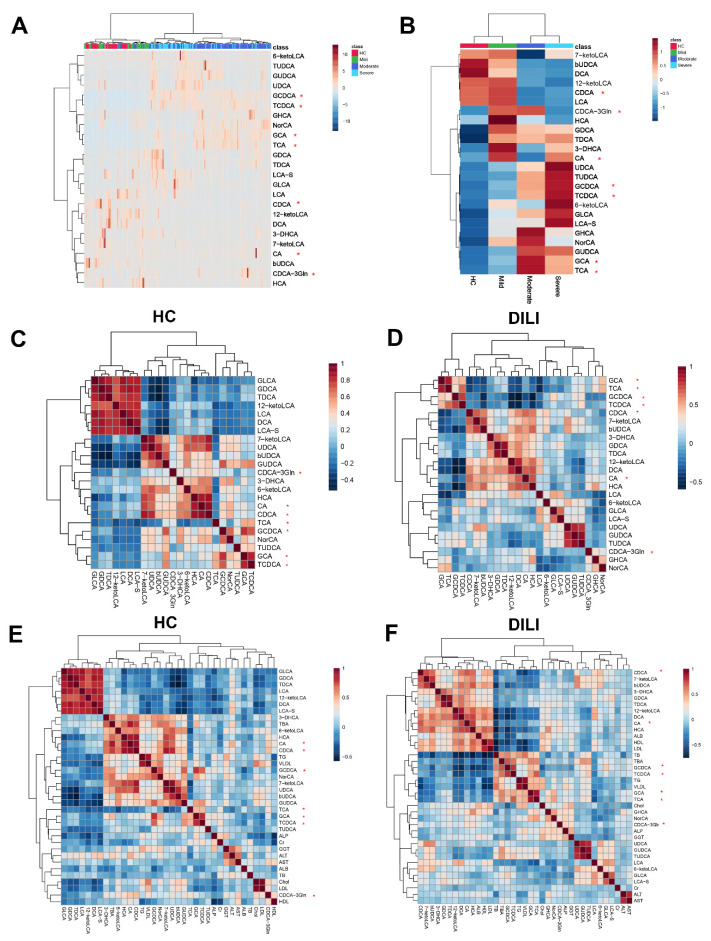
Figure 2.
Clustering analysis of bile acid among patients and groups. Bile acids clustering for each sample and each group are shown in (A,B). Correlation analysis between different bile acids in HC and DILI group were shown in (C,D). (E,F) are the correlation analysis between bile acids and biochemical index in HC and DILI group. *: primary bile acid.

