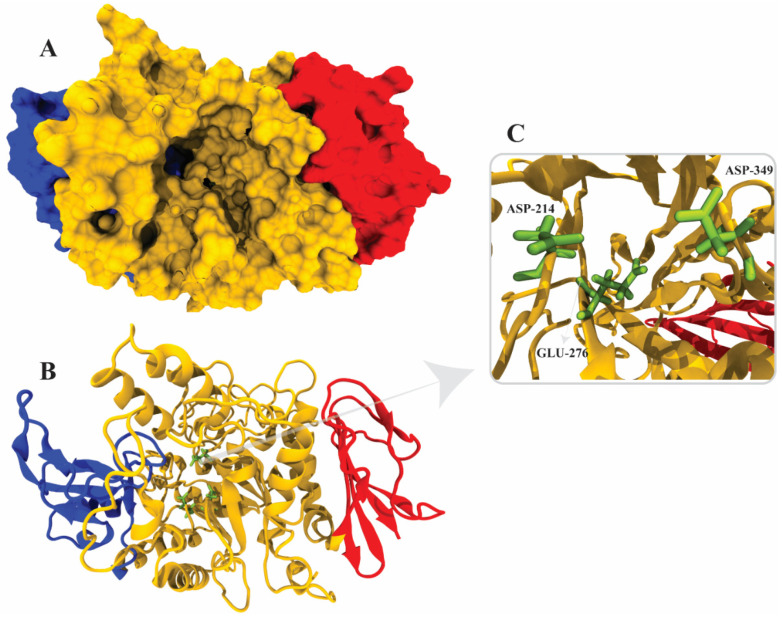
Figure 6.
Three-dimensional structure of α-glucosidase, (A) surface representation, (B) cartoon representation defining the catalytic resides in green color, (C) active site residues of α-glucosidase. The yellow color represents domain A (amino acids 1–113 and 190–512), the blue color represents domain B (amino acids 114–189), and the red color represents domain C (amino acids 513–589).

