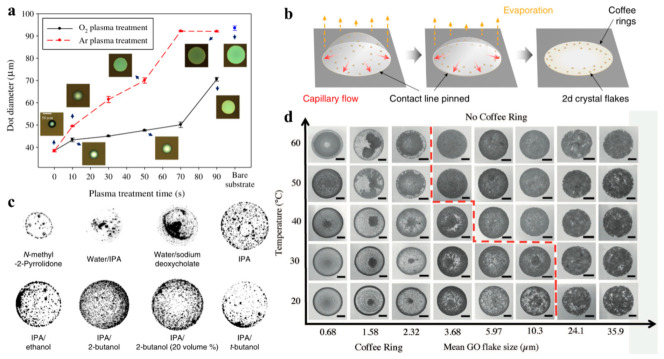
Figure 7.
(a) Variation in inkjet-printed dot diameter as a function of O2 or Ar plasma treatment time. Reprinted with permission from Ref. [62]. Copyright 2013 Elsevier. (b) Schematic drying process showing CRE formation; (c) inverted optical micrographs of dried inkjet-printed droplets on clean glass: common solution-processed 2D crystal dispersions. Formulated inks via solvent exchange in IPA or binary solvents of IPA/ethanol (10 volume %), IPA/2-butanol (10 and 20 volume %), and IPA/t-butanol (10 volume %). Reprinted with permission from Ref. [23], Copyright 2020 American Association for the Advancement of Science. (d) SEM image map for printed droplets in rows with increasing substrate temperature and in columns from left to right with increasing mean GO flake size. The dotted line indicates the parameter space where the coffee ring is fully suppressed. All scale bars are 100 µm. Reprinted with permission from Ref. [42]. Copyright 2017 John Wiley and Sons.

