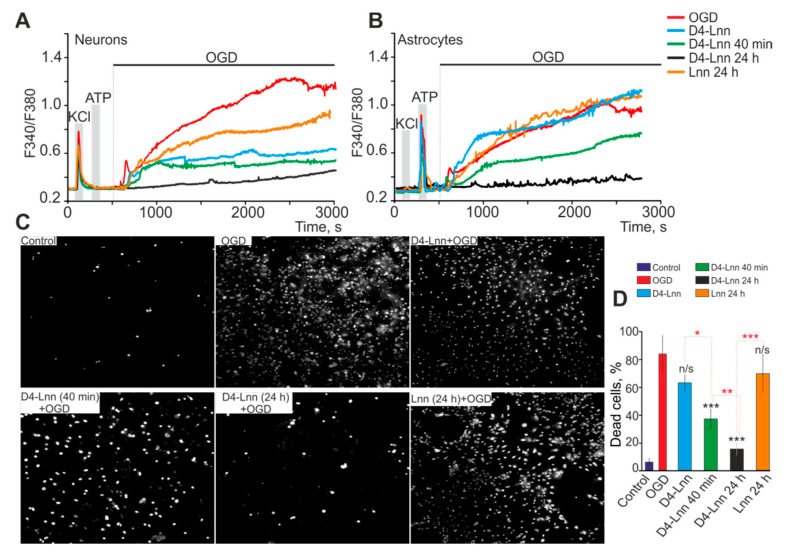
Figure 3.
Protective effect of 10 µg/mL D4-Lnn on mouse cortical cells: (A,B) Ca2+ -signals of neurons (A) and astrocytes (B) during a 40 min OGD (red traces), 40 min OGD with D4-Lnn (in media, blue traces), after 40 min D4-Lnn (green traces), and 24 h preincubation (black traces) with D4-Lnn or after 24 h pre-incubation with Lnn (orange traces). The figure shows the averaged Ca2+ signals obtained from several tens of cells for each curve. Individual Ca2+ responses of neurons and astrocytes are presented in Supplementary, Figure S3. (C) Images of cortical cell culture in Propidium Iodide fluorescence detection channel before the experiment (Control) and after 40-min OGD or OGD with different time treatment with 10 µg/mL D4-Lnn. The white dots represent the nuclei of necrotic cells. For panels A and B, the averaged Ca2+ signals in one experiment, obtained from several tens of astrocytes and neurons, are presented. Panel C presents typical vitality test results corresponding to experiments from panels A and C. (D) The percentage of PI+ cortical cells that died due to OGD-induced necrosis in the control (without OGD), in the absence of D4-Lnn (OGD) and after different time incubation with 10 µg/mL D4-Lnn or Lnn (24 h preincubation). Statistical significance was assessed using one-way ANOVA followed by the Tukey–Kramer test. Comparison of experimental groups relative to OGD: n/s—data not significant (p > 0.05), * p < 0.05, ** p < 0.01, and *** p < 0.001. Statistical differences based on incubation time with D4-Lnn are indicated by red asterisks. The results obtained on 4 cell cultures are presented. N (number of animals used for cell cultures preparation) = 4.

