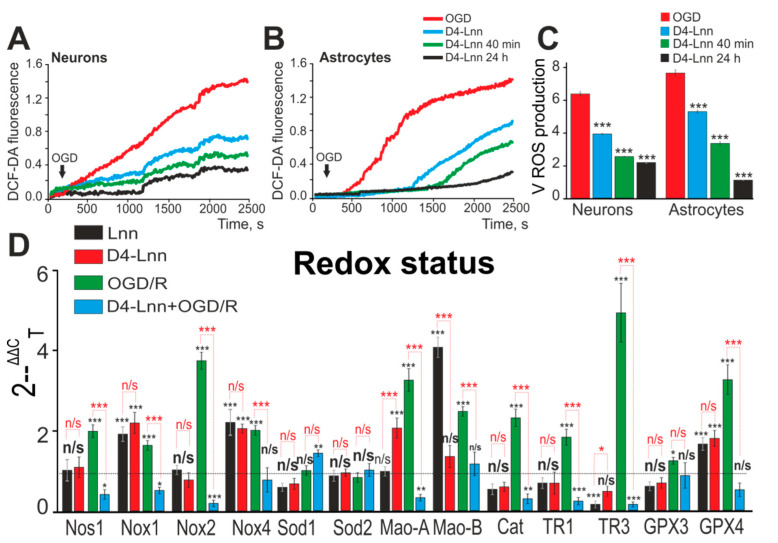
Figure 4.
ROS production in neurons (A) and astrocytes (B) under OGD conditions versus incubation time with 10 µg/mL D4-Lnn. Average kinetics of ROS production obtained from several tens of neurons and astrocytes for each curve are presented in one experiment. (C) The rate of ROS formation in neurons and astrocytes during OGD, depending on the time treatment with D4-Lnn. Average values obtained from three separate cell cultures are presented here. (D) Effect of 24 h preincubation with 10 µg/mL D4-Lnn or non-deuterated Lnn (Lnn) on baseline and OGD/R-induced expression level of genes encoding proteins regulating cell redox status. Gene expression in control cells are marked by dashed line. Statistical significance was assessed using one-way ANOVA followed by the Tukey–Kramer test. Comparison of experimental groups regarding control: n/s—data not significant (p > 0.05), * p < 0.05, ** p < 0.01 and *** p < 0.001. Comparison of experimental groups relative to each other is indicated in red. For panels D and E, the number of RNA samples is 5. N (number of animals used for cell cultures preparation) = 5.

