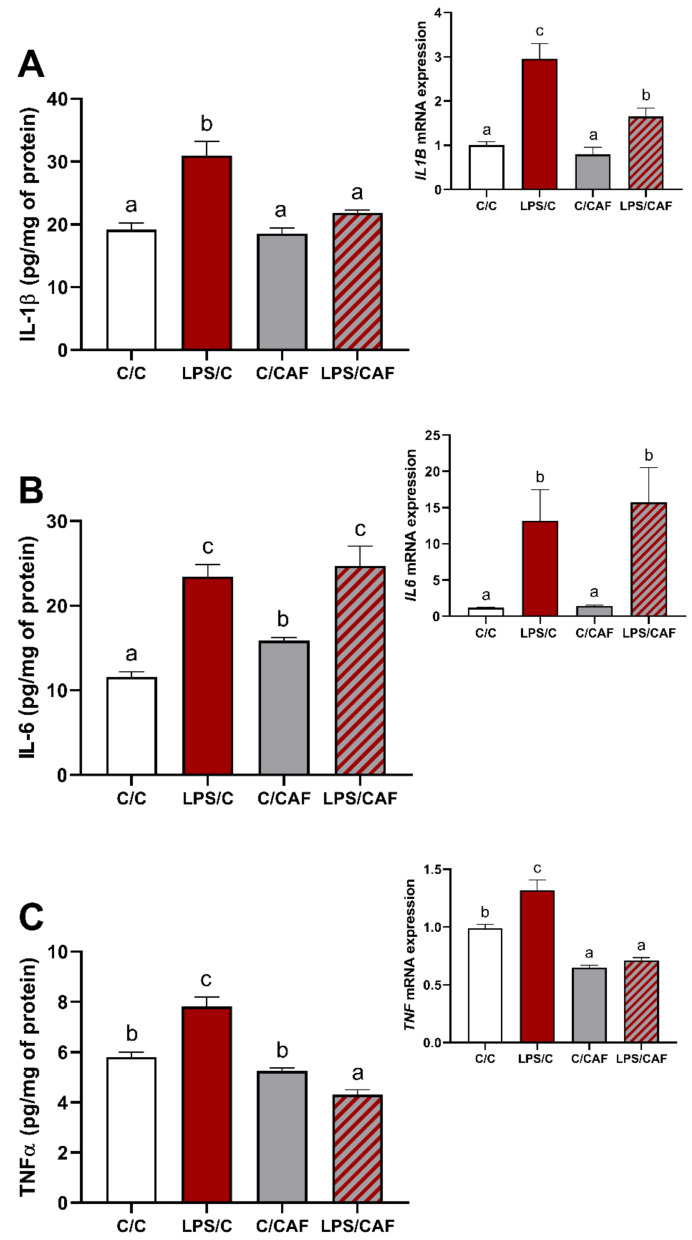
Figure 1.
Mean (±SEM) concentration and gene expression (insert) of pro-inflammatory cytokines: interleukin 1beta (A), interleukin 6 (B) and tumor necrosis factor-alpha (C) in the ovine hypothalamus in saline- (C/C, 0.9% NaCl iv., white bars), lipopolysaccharide- (LPS/C, 400 ng/kg of body mass (bm.), iv., red bars), caffeine- (C/CAF, 30 mg/kg of bm., iv., grey bars) and LPS/CAF- (red-grey hatched bars) treated female sheep. Different letters indicate significant differences at p < 0.05, according to one-way ANOVA followed by Fisher’s post hoc test comparing groups with each other.

