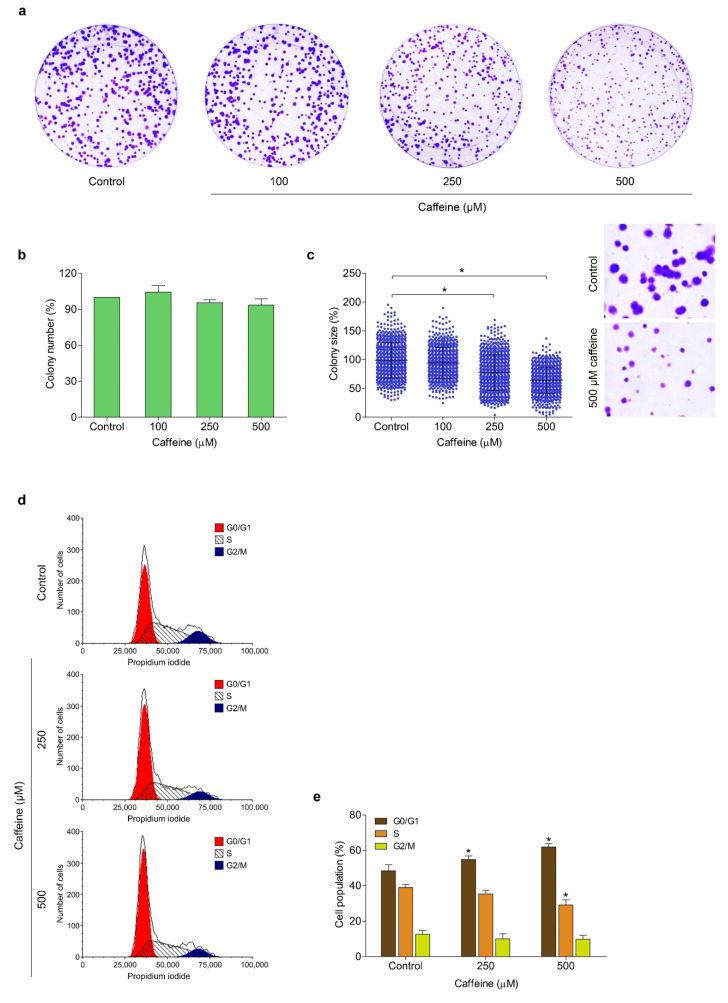
Figure 2.
Effect of caffeine on cell proliferation and cell cycle in NCI-H23 cells. (a) The cells were treated with different concentrations of caffeine (0–500 µM) and incubated for 7 days to form colonies. The cell colonies were stained with crystal violet and visualized with a flatbed scanner. (b) The histogram shows the percentage of colony number. (c) The dot plot represents the percentage of colony size. (d,e) The cells were cultured with caffeine for 24 h and stained with propidium iodide solution. The cell cycle phase was analyzed by flow cytometry and results were presented as the percentage of the cell population in G1, S, and G2/M phases of the cell cycle. Data are presented as mean ± SD (n = 3). * p < 0.05 compared with the non-treated control.

