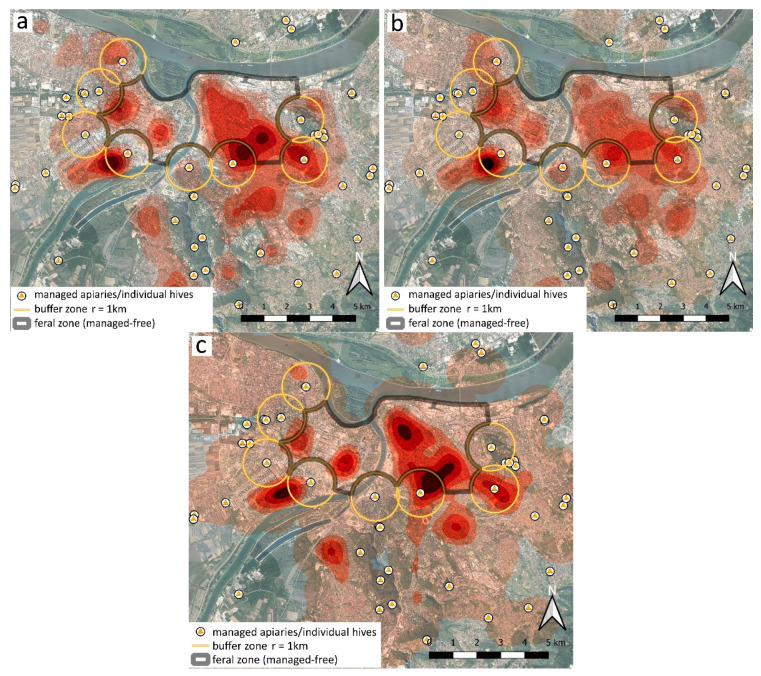
Figure 7.
Kernel Density Estimation heatmaps: shading intensity represents the increasing density of respective occurrences (defined through six density zones for the search radius 1 km), based on summed reports for 2011–2017: (a) all categories, combined (min. 5.7, max. 43.8, zonal mid-point value range: 6.5–40.1); (b) colonies (min. 3.8, max. 26.6, zonal mid-point value range: 4.1–24.4); (c) swarms (min. 2.7, max. 18.1, zonal mid-point value range: 2.9–16.6).

