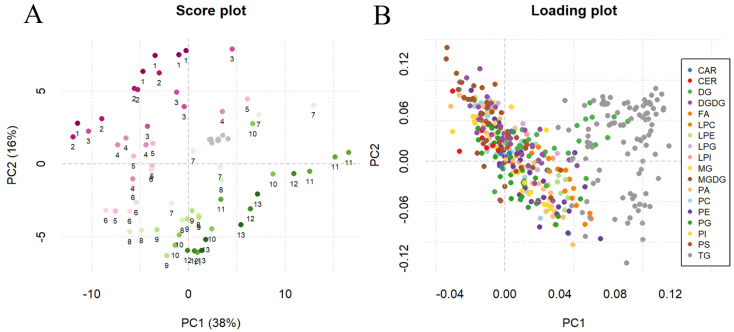
Figure 2.
Score plot (A) and loading plot (B) of the Principal Component Analysis (PCA) on log-transformed and Pareto-scaled abundance of sampled grapes, collected at 13 different time-points from the onset of véraison throughout the ripening process. In the scores plot (A), in addition to the quality control (QC) samples (grey color), different colors represent a single time-point (numbers under each sample from 1 to 13), with inclusive biological replicates. In the loading plot (B) colors represent the different classes reported in the legend.

