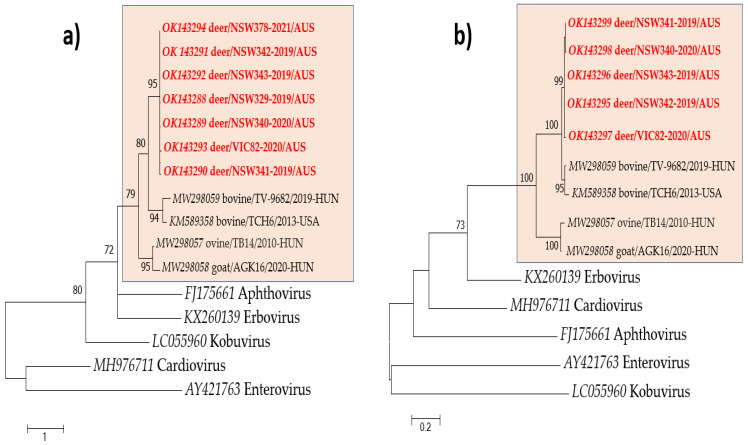
Figure 4.
Phylogenetic analyses of deer/bopivirus (in red) and representative members of family Picornaviridae based on partial VP1 (a) and 3D (b) aa sequences. A highlighted box denotes members of the genus Bopivirus. The trees were generated by the maximum-likelihood method based on JTT + G (a) and LG + G (b) substitution model with 1000 bootstrap replicates, and the statistics values > 70% are displayed above the tree branches. The scale bar indicates amino acid substitutions per site.

