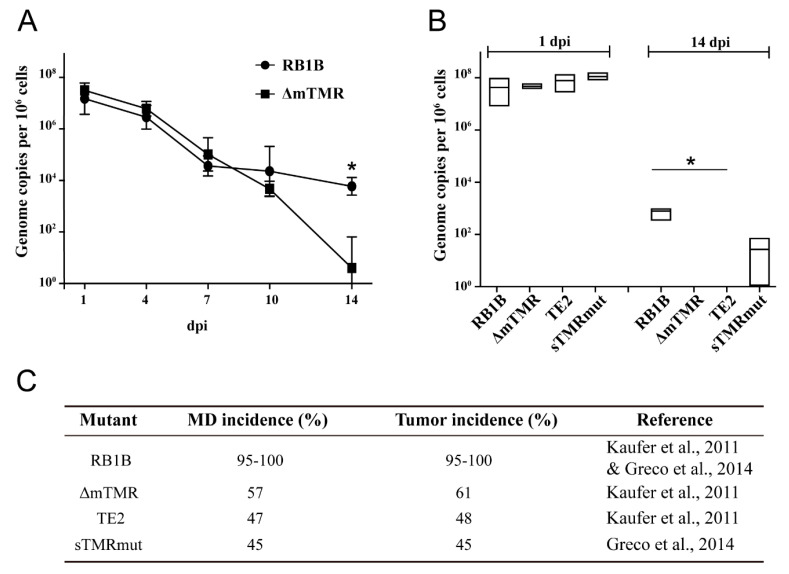
Figure 2.
Genome maintenance of wt and mutant viruses in CU91 cells. (A) Monitoring viral genome copies in infected CU91 T cells over time with indicated viruses. Mean viral genome copies per million cells of 3 independent experiments are shown (* p < 0.05, Mann–Whitney U test). (B) Viral genome maintenance after CU91 T cell infections with indicated viruses were compared. Mean viral genome copies per million cells are shown as a box with the minimum and maximum. The asterisk indicates significant differences compared to RB1B (* p < 0.05, Kruskal–Wallis test, n = 3). (C) In vivo data previously published for the wt and TMR mutant viruses with respective references [12,24]. MD = Marek’s disease.

