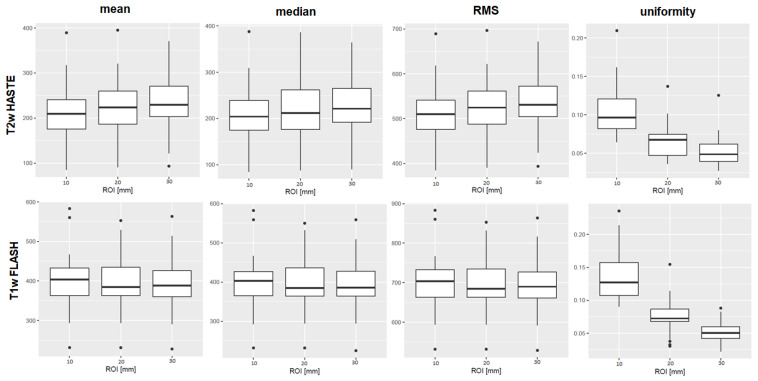
Figure 2.
Boxplots of the first-order features mean, median, root mean squared (RMS), and uniformity are shown as examples of the results. The ROI diameters 10, 20, and 30 mm are compiled on the x-axis, the numerical value of the feature on the y-axis. The upper row shows results derived from T2w TSE HASTE images, the lower row from T1w GRE FLASH images, both from 3 Tesla I. For mean, median, and RMS, there was no significant difference between the ROI sizes in the MWU-test. The first-order feature uniformity, as an example, differed significantly in both T1w and T2w sequences. Boxplots of all features, sequences and scanners are provided in the Supplementary File SF4.

