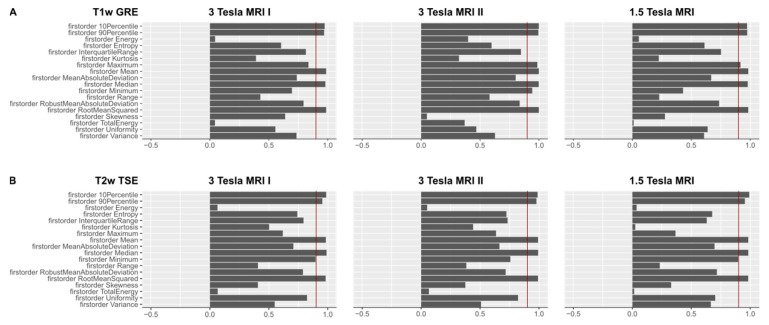
Figure 3.
(A). OCCCs20,30 of the first-order features derived from T1w images are shown for the three different MR scanners. The red benchmark at 0.9 indicates excellent agreement in the OCCCs. Mean, median, RMS, 90th, and 10th percentile showed excellent agreement on all three MR scanners. On the 3 Tesla MR scanner II, also maximum and minimum achieved excellent agreement in the OCCCs. Mean, median, and RMS also showed excellent agreement in the OCCCs10–30 (not shown), whereas excellent agreement of the 90th and 10th percentile was inconsistent. A summary of the numerical results of the OCCCs on different scanners and pulse sequences is listed in Supplementary Material 5 (see Table SF5). Complete figures of OCCCs of all features, scanners, and sequences are shown in the Supplementary Files 6–8 (see Figures SF6–SF8). (B). OCCCs20,30 of the first-order features derived from T2w images are shown for the three different MR scanners. The red benchmark at 0.9 indicates excellent agreement in the OCCCs. Mean, median, RMS, 90th, and 10th percentile showed excellent agreement on all three MR scanners. On the 3 Tesla MRI I and the 1.5 Tesla scanner, also minimum achieved excellent agreement in the OCCCs20,30. Mean, median, and RMS also showed excellent agreement in the OCCCs10–30 (not shown), whereas excellent agreement of minimum, 90th and 10th percentile was inconsistent. A summary of the numerical results of the OCCCs on different scanners and pulse sequences is listed in Supplementary Material 5 (see Table SF5). Complete figures of OCCCs of all features, scanners, and sequences are shown in the Supplementary Files 6–8 (see Figures SF6–SF8).

