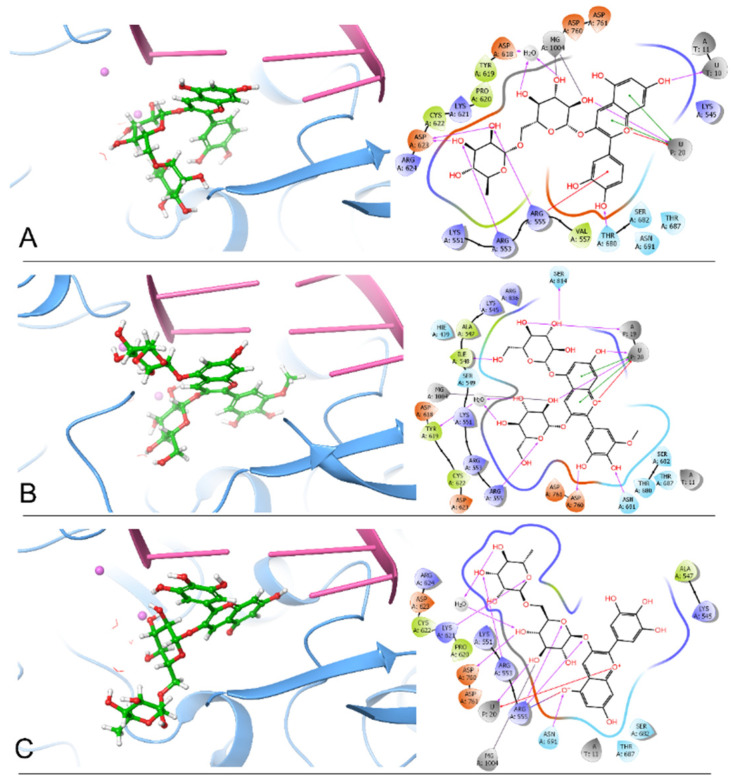
Figure 1.
The docking poses and 2D ligand–protein interaction diagrams of 7BV2 and the top three ligands: (A), Cyanidin 3-O-rutinoside; (B), Petunidin 3,5-O-diglucoside; (C), Delphinidin 3-O-rutinoside. The pink spheres represent Mg2+ ions. The purple arrows indicate the hydrogen bonds; the green line represents π-π stacking; the red line represents π–cation interaction; the blue-red line represents the salt bridge; the gray line represents metal coordination.

