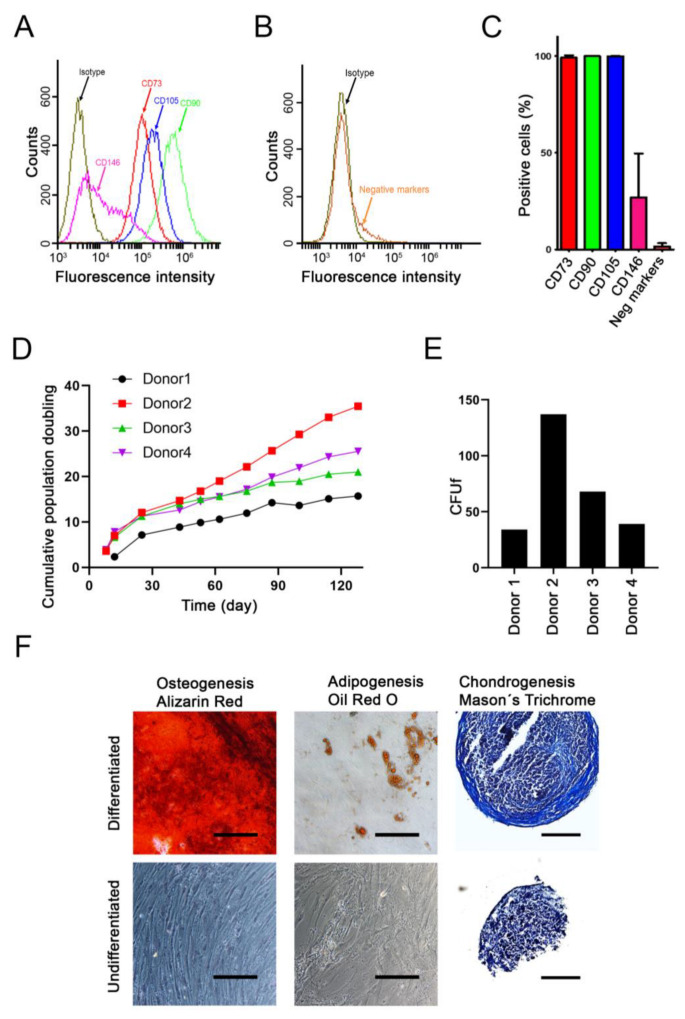
Figure 1.
Characterization of donor MSCs. (A–C) Flow cytometry characterization of positive- and negative-associated CD markers. (A) A representative donor overlay plot is shown for the expression of positive markers: CD73, CD90, CD105 and CD146, in relation to the isotype control. (B) A representative donor overlay plot is shown for the expression of negative markers CD11b, CD19, CD34, CD45 and HLA-DR, in relation to the isotype control. (C) Quantification of the expression of positive and negative CD markers (mean + SD, n = 4). (D) Cumulative population doubling assessed for each of the donor cells for a total of 128 days. (E) Colony forming unit fibroblastic (CFUf) was determined after two weeks of culture with the starting density of 300 cells in a T25 flask. (F) Undifferentiated and differentiated cells from a representative donor are shown. Different staining was used to confirm the differentiation of the cells: for osteogenesis (5 weeks, Alizarin red), for adipogenesis (4 weeks, Oil red O), and for chondrogenesis (5 weeks, Masson’s trichrome). Scale bar = 200 μm.

