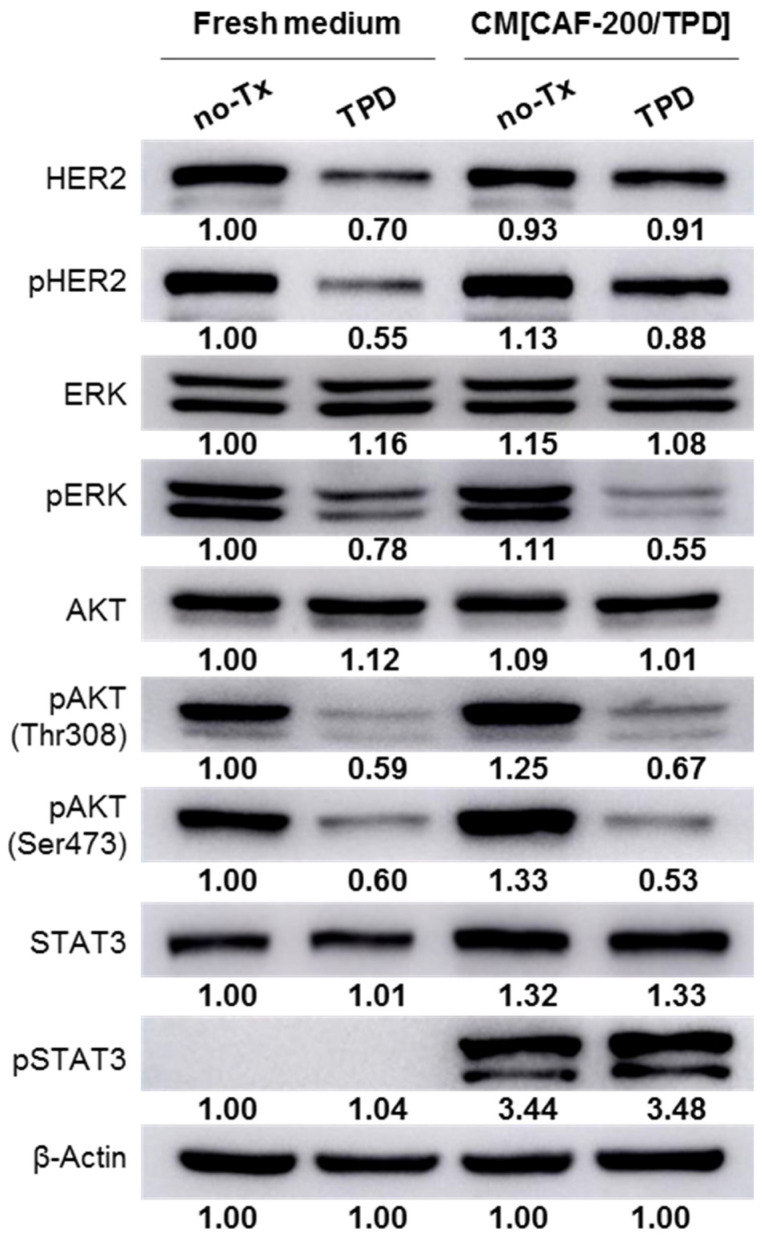
Figure 3.
After treatment with CM[CAF-200/TPD], BT-474 cells showed changes in phosphorylation markers of cell division. BT-474 cells were treated for 72 h with TPD, either in fresh culture medium or CM[CAF-200/TPD]. Analysis of phosphorylation pattern of HER2 and other downstream proteins was assessed by WB. Representative images of three replicates are depicted. Relative abundance levels of protein up- or downregulation were determined by densitometric analysis of the images.

