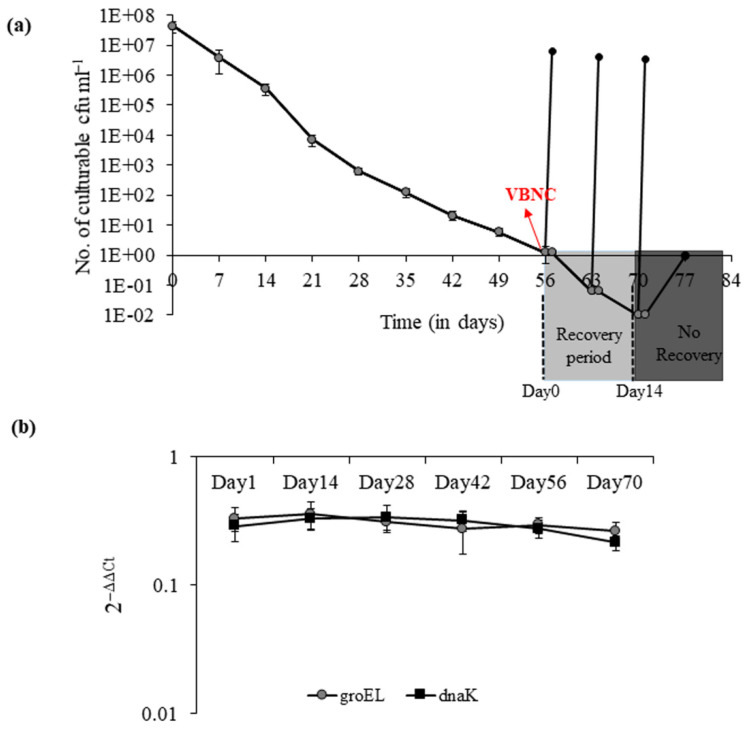
Figure 1.
Progress curve of V. cholerae culturability and viability during the course of VBNC induction.(a) Culturable cell count was determined for V. cholerae AN59 during the induction of VBNC state at 4 °C (●) in ASW. Recovery was induced on days 56, 63, 70 and 77 after entry into VBNC state by temperature upshift from 4 °C to 37 °C (●). Each bar represents the mean ± SE of three independent experiments. (b) The relative mRNA expression of transcripts of molecular chaperones (■) dnaK and (●) GroEL were analyzed during the course of VBNC induction as an indicator of cell viability.

