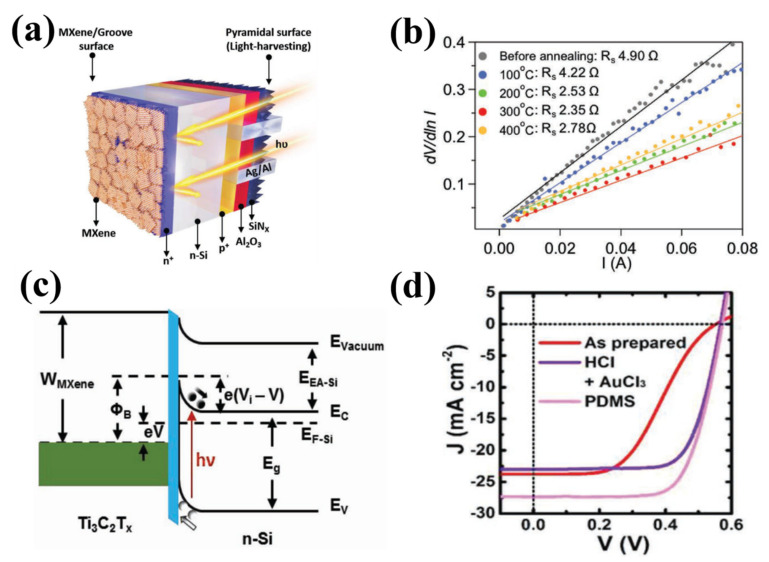
Figure 22.
(a) Schematic diagram of the device. (b) The series resistance (Rs) of the device extrapolated from dV/dln versus curves with and without RTA treatment. Reproduced with permission from Reference [188]. Copyright 2019, Wiley-VCH. (c) The energy band diagrams of Ti3C2Tx/SiO2/Si heterojunction. (d) The J-V curve of the device under illumination. Reproduced with permission from Reference [189]. Copyright 2019, Wiley-VCH.

