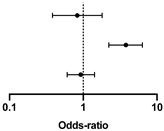
Table 4.
Cox regression analysis of survival according to baseline diet and CCI.
| CI 95% | |||||
|---|---|---|---|---|---|
| Hazard Ratio | Lower | Higher | p-Value | ||
| Protein intake at referral ≥ 0.8 g/kg/day | 0.832 | 0.383 | 1.809 |

|
0.642 |
| CCI dichotomized at median (≥8) | 3.788 | 2.226 | 6.352 | <0.001 | |
| Gender (female/male) | 0.928 | 0.605 | 1.424 | 0.733 |
Concordance c-index: 0.65 (±0.029SE); AIC: 981.6; CCI: Charlson Comorbidity Index. In bold, significant differences.
