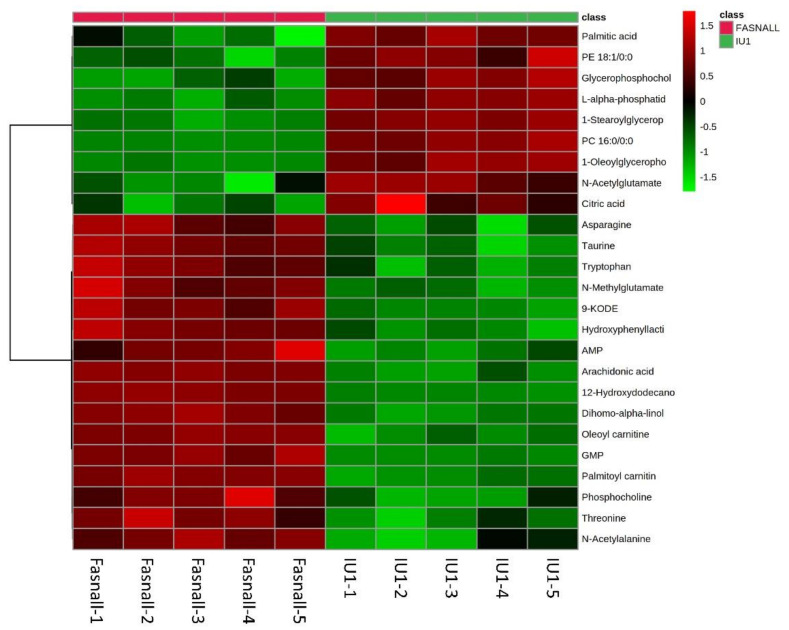
Figure 7.
Heatmap analysis of USP14 and FASN inhibitor-treated LNCaP cells. The heatmap represents the intensities of the 25 most significantly (p < 0.05) altered metabolites between groups. Group is indicated at the top of the figure by red (Fasnall, n = 5) or green (IU1, n = 5). Data were sum normalized, log transformed, and autoscaled.

