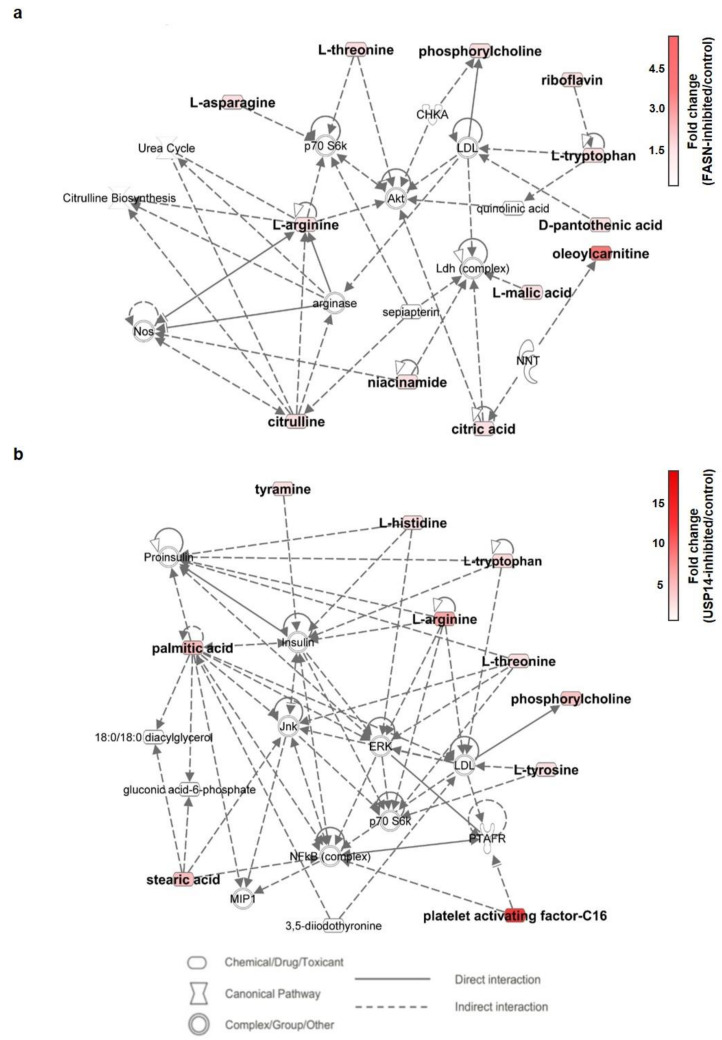
Figure 8.
Metabolic network analysis using Ingenuity Pathway Analysis (IPA) software. The network shows altered metabolites involved in (a) FASN-inhibited and (b) USP14-inhibited LNCaP cells. The red nodes indicate the upregulated molecules, and the intensity indicates the fold change. The specific metabolites involved in network (a) are asparagine, pantothenic acid, citric acid, riboflavin, arginine, citrulline, malic acid, niacinamide, and oleoylcarnitine. In network (b), they are histidine, palmitic acid, stearic acid, tyramine, and PAF-C16. The two networks show different examples of small molecule biochemistry and molecular transport.

