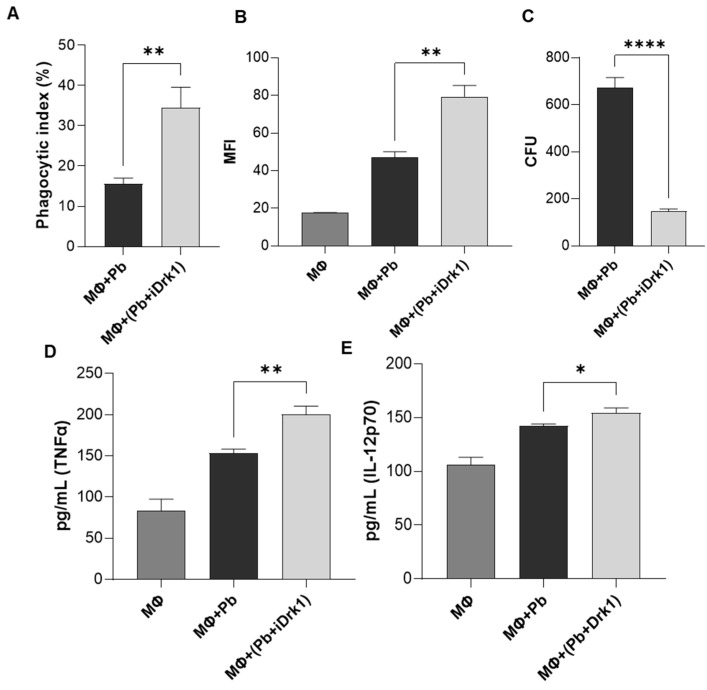
Figure 4.
Phagocytosis assay. 2.5 × 10⁵ J774 cells (MΦ) were plated in RPMI medium supplemented with 10% FBS. Then the cells were primed for 30 min with LPS 100 ng/mL. In parallel, P. brasiliensis yeasts were subjected to 25 µg/mL of iDrk1 for 24 h. The interaction was carried out in a 2:1 ratio (yeast:macrophages) for 24 h at 37 °C and 5% CO2. After this period, the cells were stained and visualized under an optical microscope to count the internalized yeasts. (A) Phagocytic index was calculated, where p-value ≤ 0.005 (**). (B) Phagocytosis assay performed by labeling P. brasiliensis yeasts with CFSE prior to interaction with macrophages. Fluorescence quantification was performed by flow cytometry and relative quantification was obtained through the median intensity (MFI) where p-value ≤ 0.005 (**). (C) CFU determination from yeasts recovered from macrophages, where p-value ≤ 0.0001 (****). Cytokine assay from J774 cell supernatant after interaction with P. brasiliensis submitted or not with iDrk1. Macrophages were plated in RPMI medium supplemented with 10% FCS. Then, cells were primed for 30 min with LPS 100 ng/mL. In parallel, P. brasiliensis yeasts were subjected to 25 µg/mL of iDrk1 for 24 h. The interaction was carried out in a 2:1 ratio (yeast:macrophages) for 24 h at 37 °C and 5% CO2. After this period, the supernatant was collected and the cytokines (D) TNFα, (E) IL-12p70 were measured, where p-value ≤ 0.05 (*), p-value ≤ 0.01 (**).

